Creating a Dashboard
To create a new dashboard based on the available charts, follow these instructions:
-
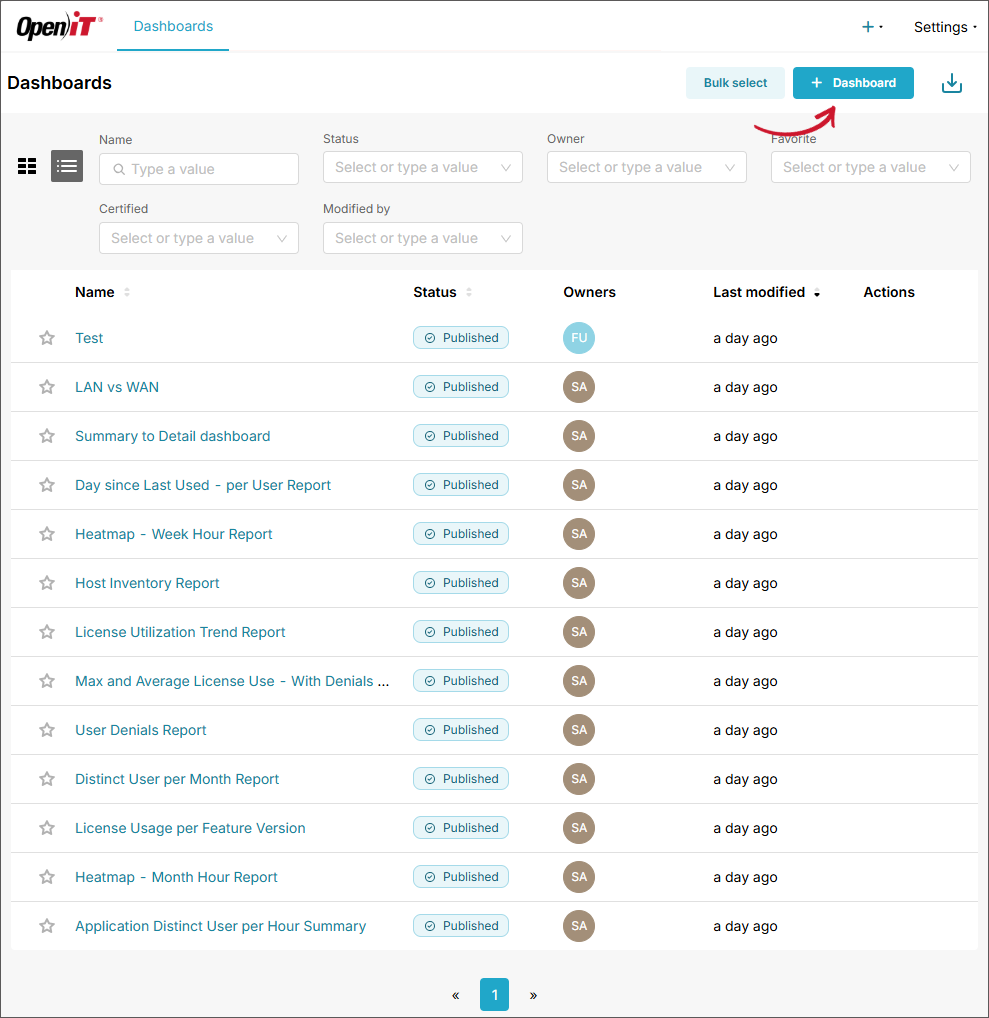
On the Dashboards page, click + Dashboard located at the upper-right corner of the page. This will redirect to an empty dashboard.
 Adding a Dashboard
-
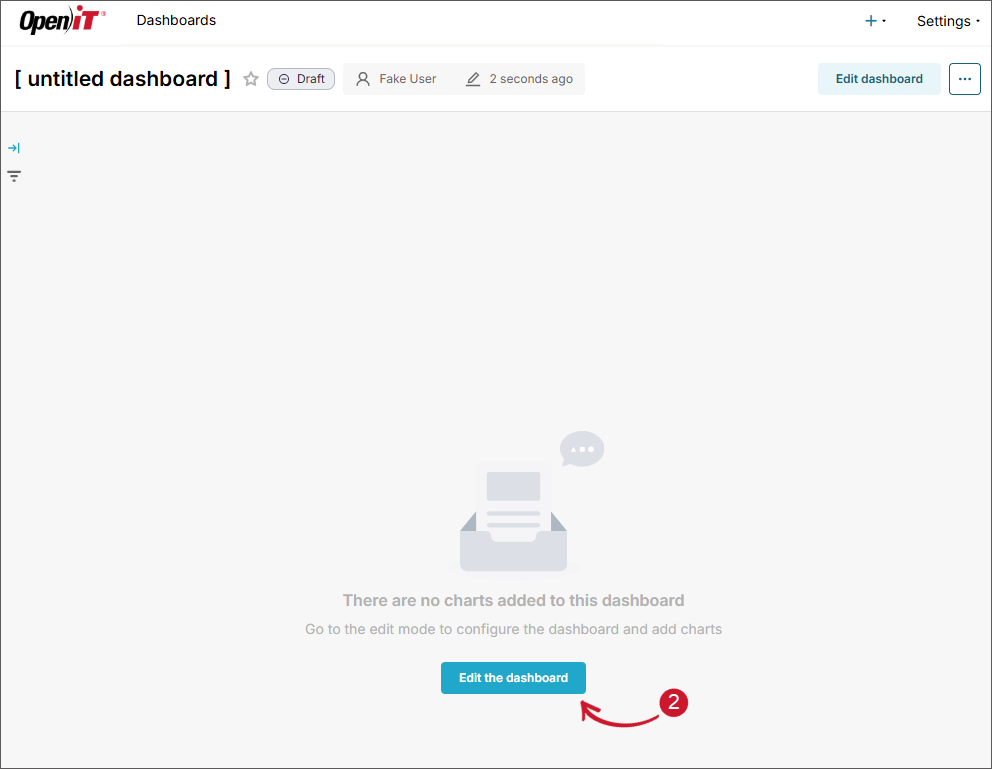
Click Edit the dashboard.
 Editing a Dashboard
-
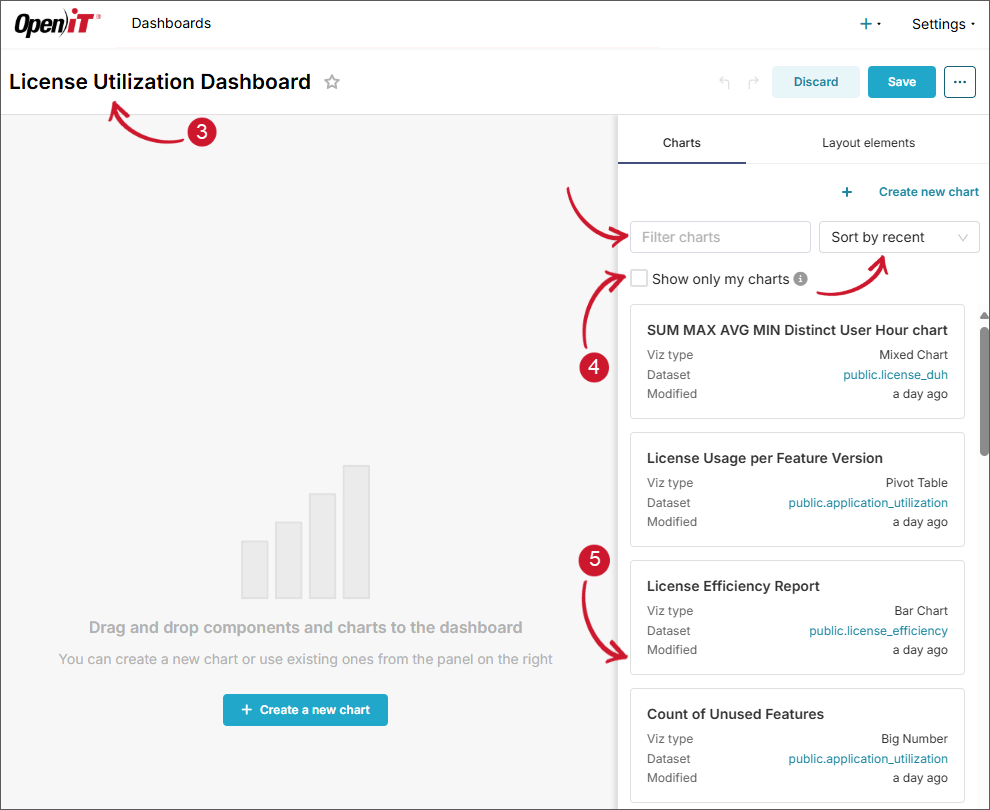
Click the title placeholder ([untitled dashboard]) located at the upper-left corner of the page. Provide a descriptive title for the dashboard.
-
In the Property pane, located at the right side of the page, uncheck Show only my charts. This will list all the available charts that you can include in your dashboard.
NOTEUse the Filter and Sort functionalities for your ease of use.
-
From the list of charts, drag the desired chart and drop it on the dashboard pane.
 Adding Charts to a Dashboard
NOTE- You can only include a chart in a dashboard once.
- Use the resizing functionality of the dashboard to achieve your requirements.
- The dashboard automatically displays the grid guide; use this to layout the charts properly.
-
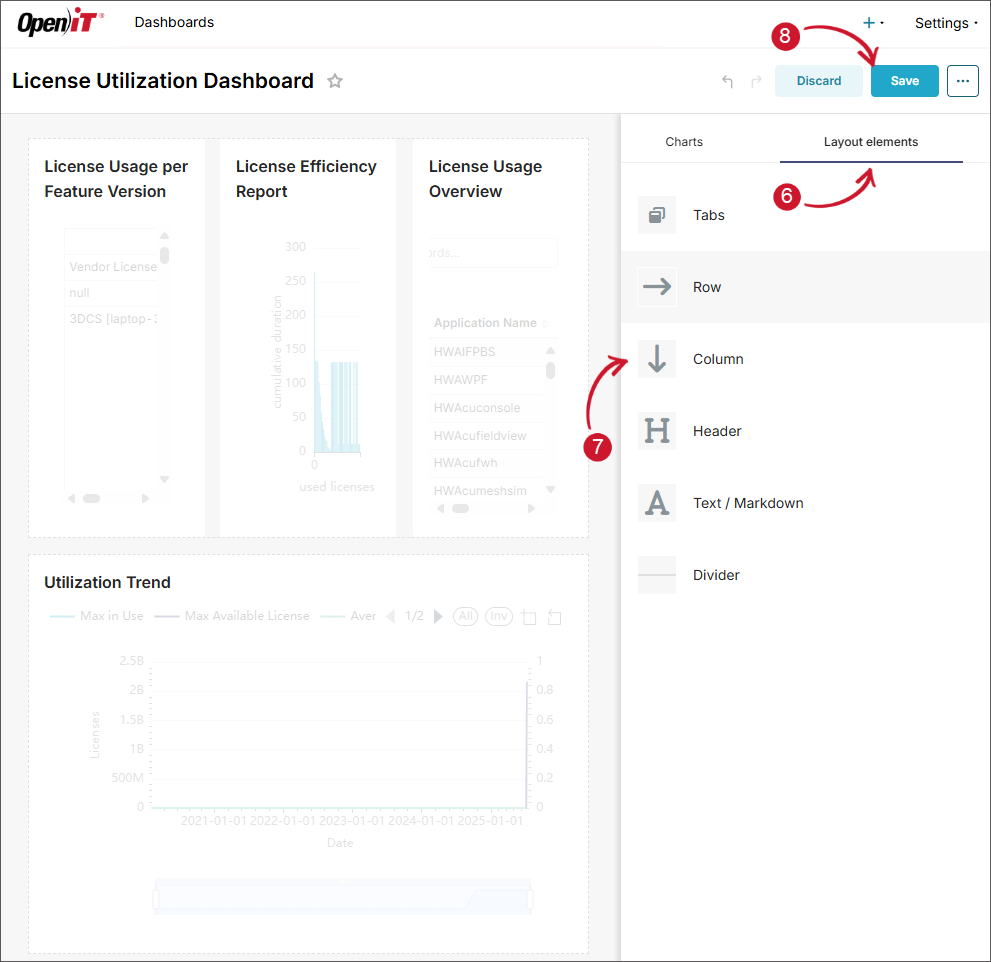
Once the selection is done, click the Layout elements tab. This provides more elements that can be added to the dashboard that can help achieve your requirements.
The following are the available elements:
Element Purpose Usage Tabs Organize dashboard content into separate views or sections Place related charts in different tabs to reduce visual clutter and improve navigation Row A horizontal layout container Align charts or elements side-by-side horizontally within the dashboard Column A vertical layout container Stack charts or elements vertically, often placed inside rows for grid layouts Header Display prominent titles or section headings Used for dashboard titles or to label different parts of the dashboard Text/Markdown Add formatted text, links, images, and basic HTML using Markdown Useful for adding explanations, KPIs, instructions, or custom labels Divider Add a horizontal line to visually separate sections of the dashboard Enhances clarity by breaking up different parts of the dashboard Superset Dashboard Layout Elements
-
Drag the desired element from the list and drop it on the exact place in the dashboard where you want to put the element.
tipRed indicates that the element is not applicable on that space, and blue if applicable.
-
Once all is set, click Save located at the upper-right corner of the page.
 Adding Layout Elements to a Dashboard
-
Once saved, the dashboard will be displayed. Review the layout of the dashboard.
-
On the left side of the page, click the funnel icon. The Filters pane will appear.
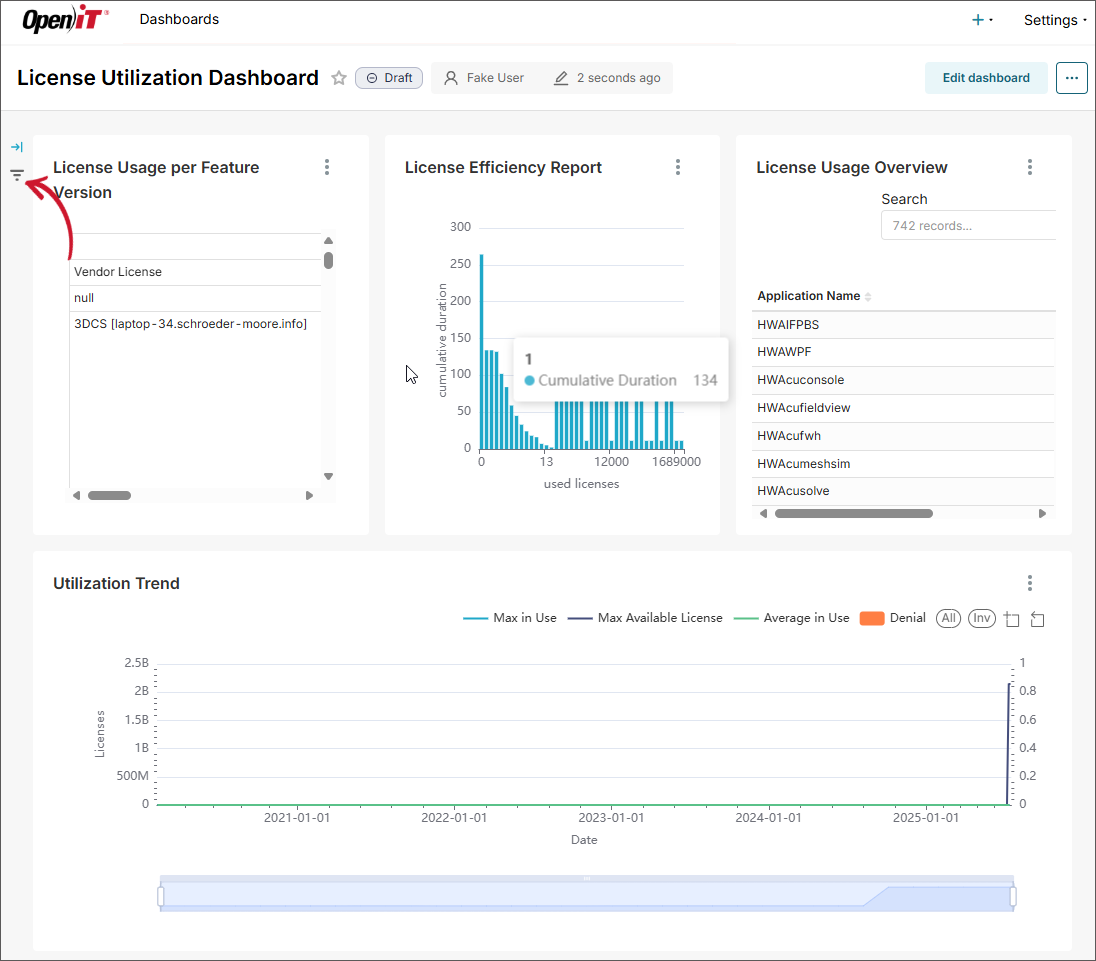 Dashboard Filters Pane
-
Click the gear icon and choose Add or edit filters. The Add and edit filters dialog will appear.
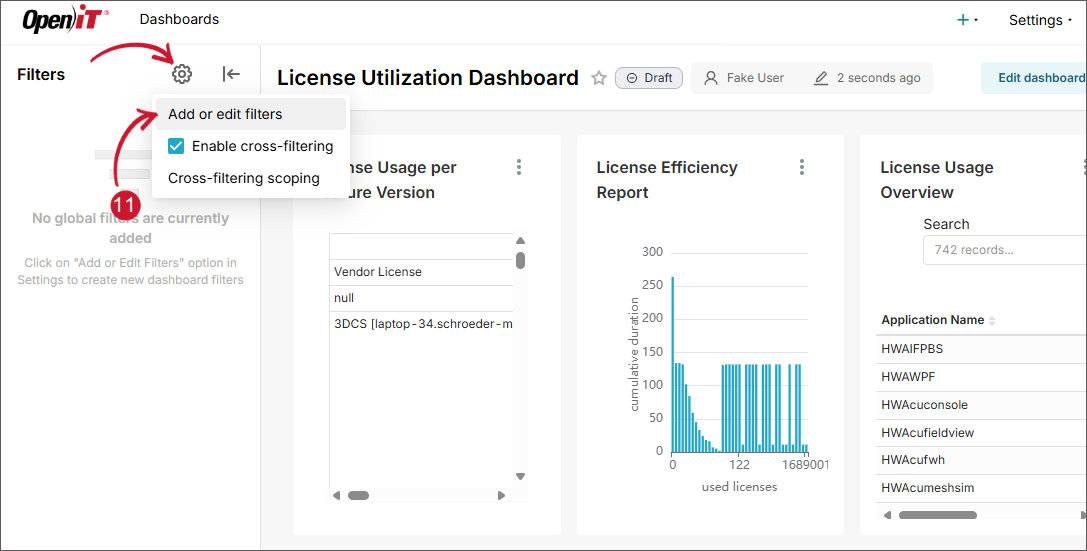 Adding Filters
-
Set the properties of the filter to achieve the required filters for the dashboard.
tip- Make sure that the filters configuration is properly set based on your requirements. This determines the behavior of the filters in your dashboard.
- Use the Add Filter located at the bottom-left corner of the dialog to add and configure more filters.
- Use the delete icon associated with a filter to remove the filter.
-
Click Save. This will display all the configured filters in the Filters pane.
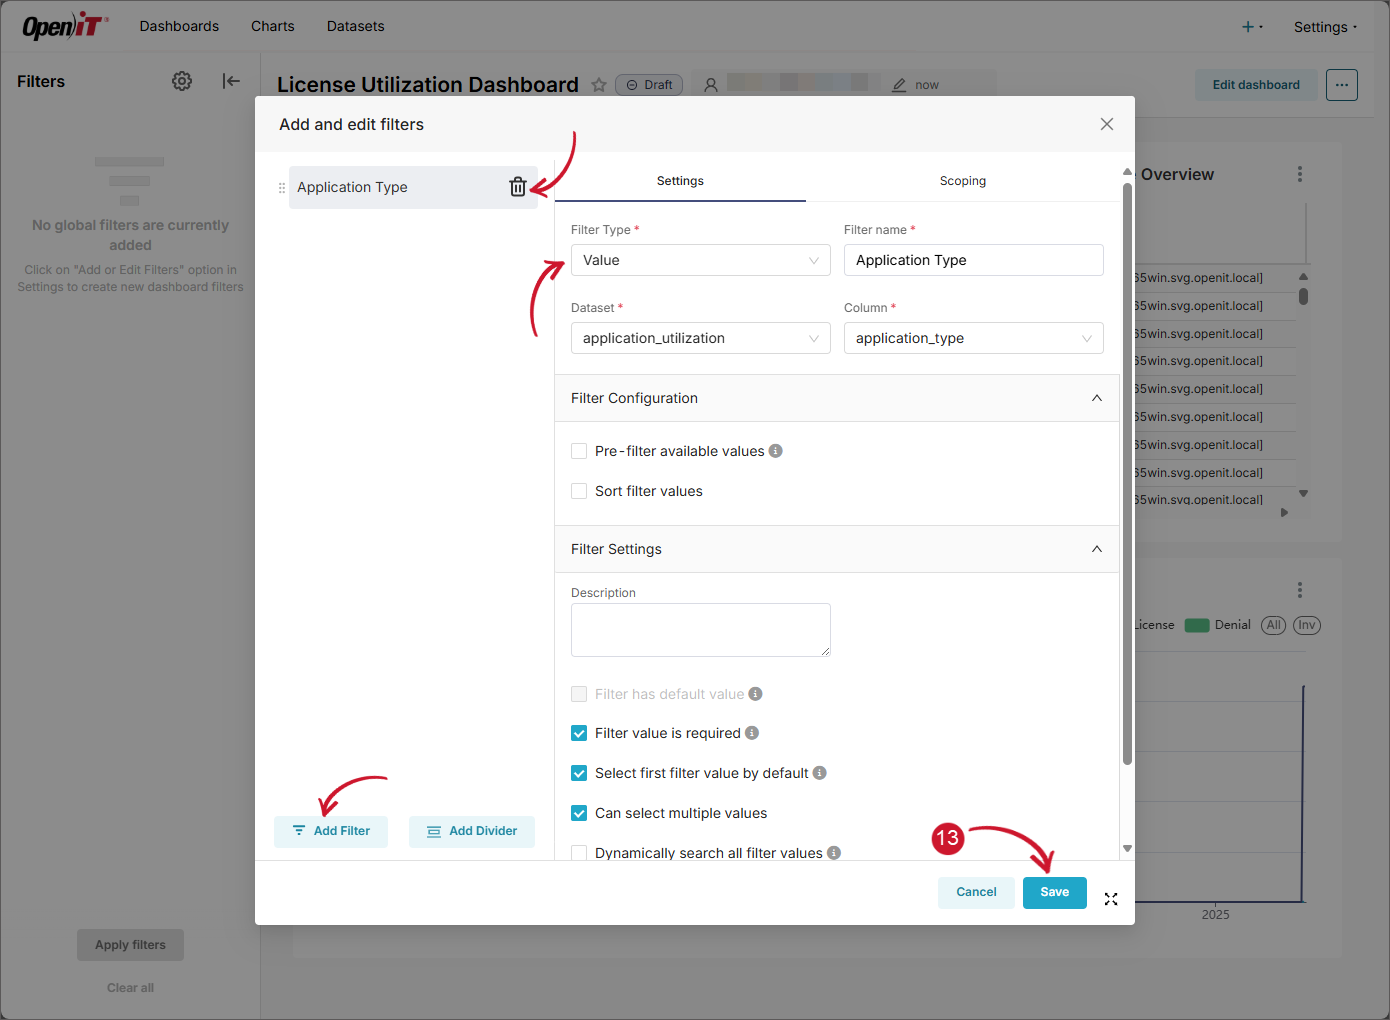 Configuring Filters
For more information, refer to the official Apache Superset documentation.