Distinct user per Month Report
This dashboard presents a chart and table that shows the number of unique users per application type per month.
Dashboard Generation
To generate the dashboard, follow these instructions:
-
Set the following filters based on your specific requirements:
a. Date Time - date range that will be included in fetching the data. This is set as default to Custom (start – 2023-03-02 00:00:00 and end – 2023-03-01 00:00:00). To configure:
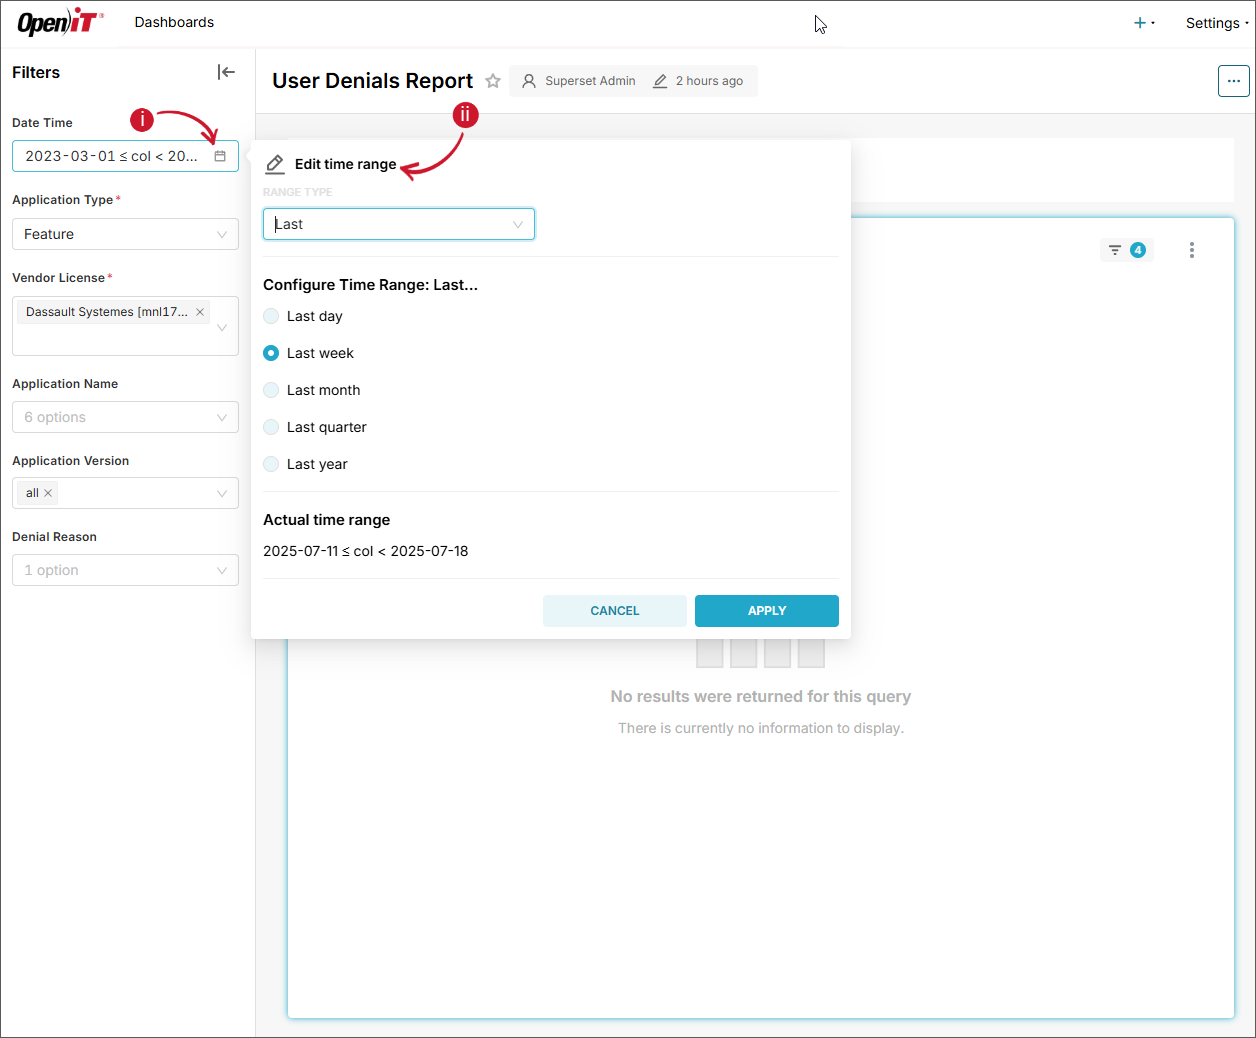
- Click the calendar icon located in the left side of the filter. The Edit time range will be displayed.
- Choose among the available Range Type.
-
When Last is selected, select among the predefined time ranges:
- Last day
- Last week
- Last month
- Last quarter
- Last year
 Date Time - Last
-
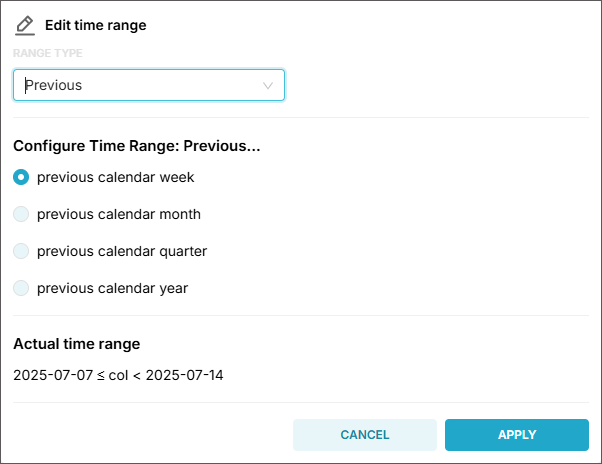
When Previous is selected, select among the predefined time ranges:
- previous calendar week
- previous calendar month
- previous calendar quarter
- previous calendar year
 Date Time - Previous
-
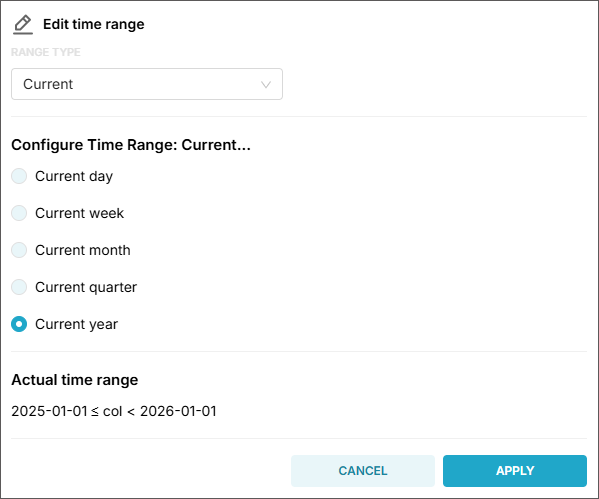
When Current is selected, select among the predefined time ranges:
- Current day
- Current week
- Current month
- Current quarter
- Current year
 Date Time - Current
-
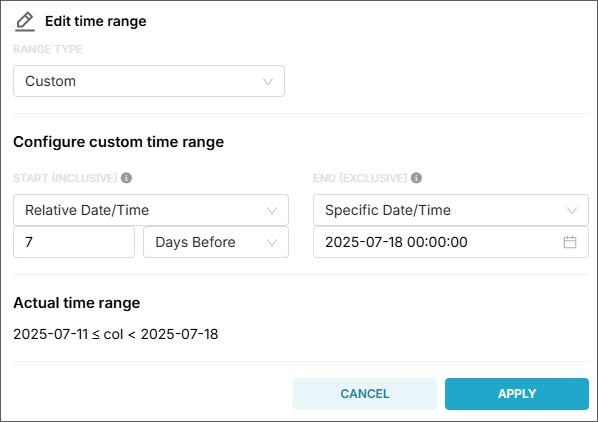
When Custom is selected, configure the following information:
- Start (inclusive) - choose among the available options (Now, Specific Date/Time, Relative Date/Time, and Midnight)
- End (exclusive) - choose among the available options (Now, Specific Date/Time, Relative Date/Time, and Midnight)
 Date Time - Custom
tipSuppose you have a time range:
- Start: 2025-07-01 00:00:00
- End: 2025-07-02 00:00:00
This range includes all timestamps starting 2025-07-01 00:00:00, up to but not including 2025-07-02 00:00:00.
So:
✅ 2025-07-01 00:00:00 - included
✅ 2025-07-01 23:59:59 - included
❌ 2025-07-02 00:00:00 - not included -
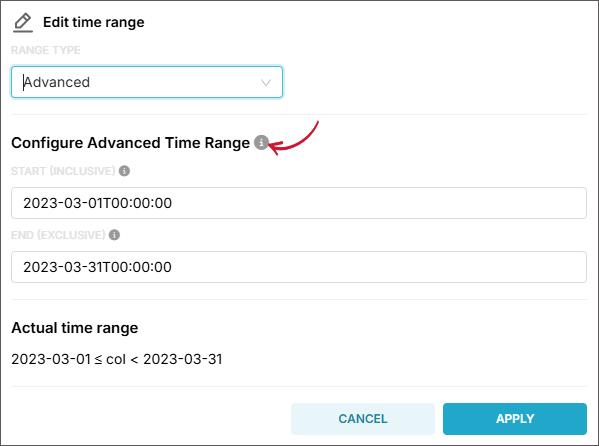
When Advanced is selected, provide the following information:
- Start (inclusive) - it can be
YYYY,YYYY-MM,YYYY-MM-DD,YYYY-MM-DD HH,YYYY-MM-DD HH:MM, orYYYY-MM-DD HH:MM:SS. - End (exclusive) - it can be
YYYY,YYYY-MM,YYYY-MM-DD,YYYY-MM-DD HH,YYYY-MM-DD HH:MM, orYYYY-MM-DD HH:MM:SS.
 Date Time - Advanced
tipHover the information icon beside Configure Advanced Time Range for examples and guides in setting time ranges.
- Start (inclusive) - it can be
-
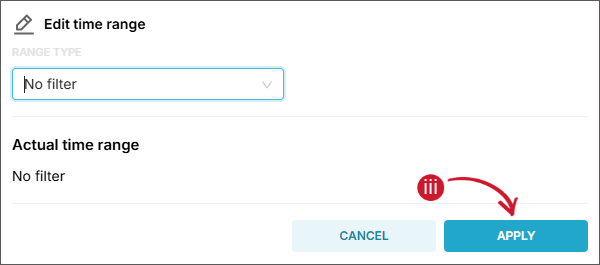
When No filter is selected, all available data will be included in fetching.
 Date Time - No Filter
- Click Apply.
tipUse the Actual time range as a reference when validating the settings.
b. Application Type (required) - name of the grouping in which data types are classified, such as Feature, Handle, and Package.
c. Vendor License (required) - name of the vendor license in each specific type of feature. Multiple selection is allowed.
-
Click Apply filters.
Wait until the report has finished processing and is displayed.
Filtering using Chart and Table Items
Once the dashboard is generated, you can begin interacting with the charts and visualizations. Each sub-dashboard contains interconnected charts, each designed to serve a specific analytical purpose. These charts are synchronized — applying a filter to one will automatically update the data displayed in the others. This dynamic interaction allows for progressively deeper insights as users explore different data segments.
To apply a filter:
- In the bar chart, click a specific bar. This will automatically filter the table based on the clicked Application Type bar (e.g., feature).
- In the table, click an item in one of the classifications that is desired to filter the dashboard on. The available classifications are date_time and application_type. This will automatically filter the bar chart based on the clicked classification item.
- Only classification-level items can be selected.
- Only single selection is allowed.
Available Sub-dashboards
Distinct Users per Month Bar Chart
This bar chart displays the number of distinct users over time, grouped by application type. The x-axis represents the time intervals (days), while the y-axis shows the count of unique users within each time period. Each bar is segmented or color-coded to differentiate between various application types, allowing for a comparative view of user engagement over time.
Distinct Users per Month
A table showing the number of unique users over time classified by Application Type.