Application Distinct User per Hour Summary
This dashboard displays the number of unique users utilizing the selected application's license across various time resolutions, with support for detailed views down to an hourly level.
Dashboard Generation
To generate the dashboard, follow these instructions:
-
Set the following filters based on your specific requirements:
a. Date Time - date range that will be included in fetching the data. This is set as default to Custom (start – 2023-03-02 00:00:00 and end – 2023-03-01 00:00:00). To configure:
- Click the calendar icon located in the left side of the filter. The Edit time range will be displayed.
- Choose among the available Range Type.
-
When Last is selected, select among the predefined time ranges:
- Last day
- Last week
- Last month
- Last quarter
- Last year
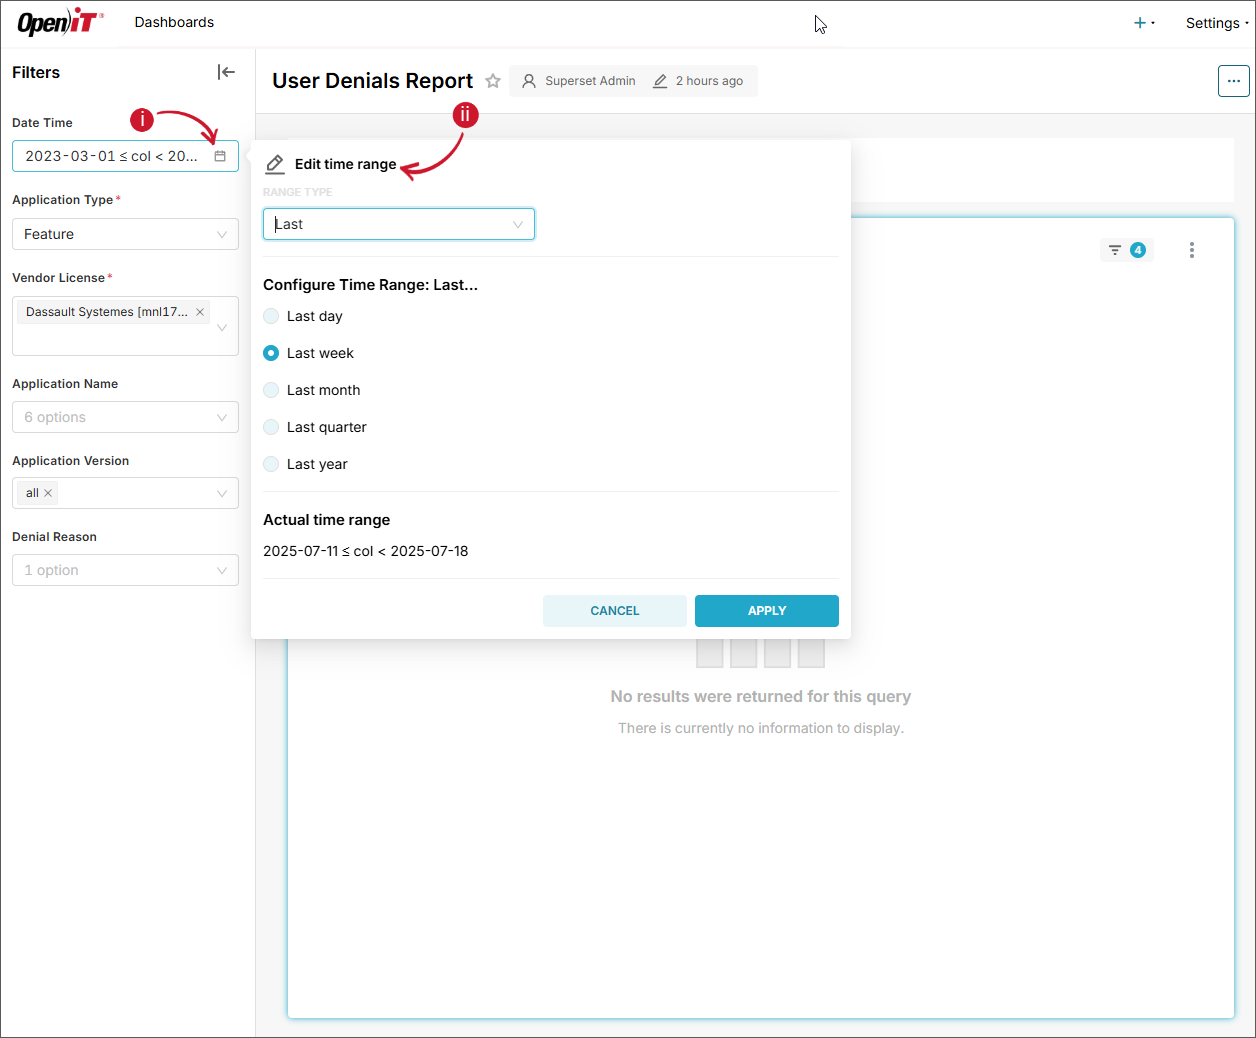 Date Time - Last
-
When Previous is selected, select among the predefined time ranges:
- previous calendar week
- previous calendar month
- previous calendar quarter
- previous calendar year
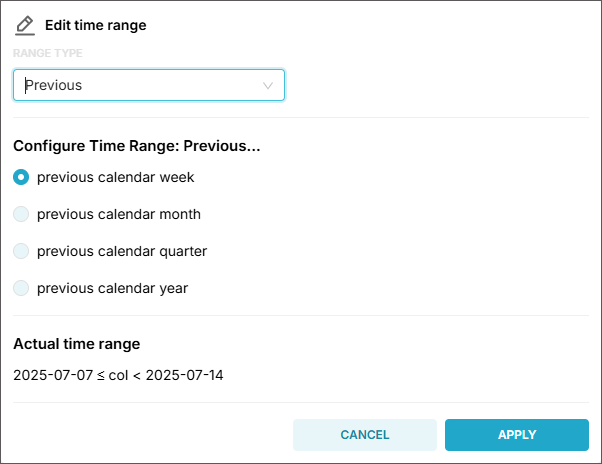 Date Time - Previous
-
When Current is selected, select among the predefined time ranges:
- Current day
- Current week
- Current month
- Current quarter
- Current year
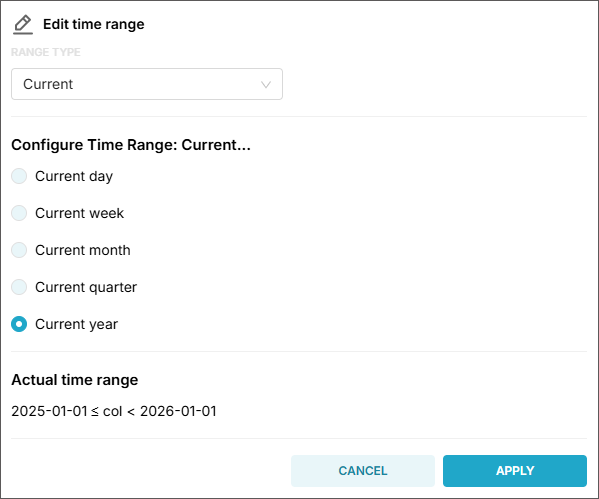 Date Time - Current
-
When Custom is selected, configure the following information:
- Start (inclusive) - choose among the available options (Now, Specific Date/Time, Relative Date/Time, and Midnight)
- End (exclusive) - choose among the available options (Now, Specific Date/Time, Relative Date/Time, and Midnight)
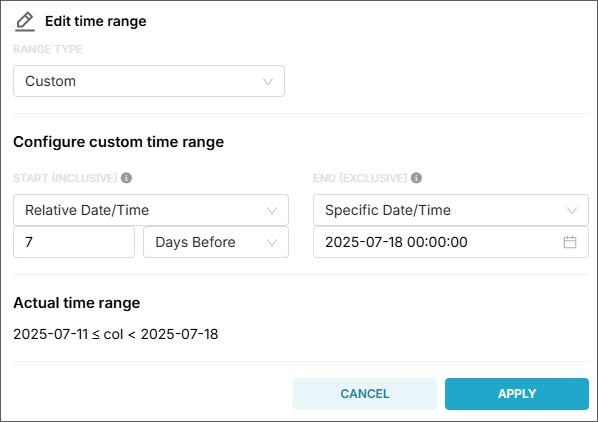 Date Time - Custom
tipSuppose you have a time range:
- Start: 2025-07-01 00:00:00
- End: 2025-07-02 00:00:00
This range includes all timestamps starting 2025-07-01 00:00:00, up to but not including 2025-07-02 00:00:00.
So:
✅ 2025-07-01 00:00:00 - included
✅ 2025-07-01 23:59:59 - included
❌ 2025-07-02 00:00:00 - not included -
When Advanced is selected, provide the following information:
- Start (inclusive) - it can be
YYYY,YYYY-MM,YYYY-MM-DD,YYYY-MM-DD HH,YYYY-MM-DD HH:MM, orYYYY-MM-DD HH:MM:SS. - End (exclusive) - it can be
YYYY,YYYY-MM,YYYY-MM-DD,YYYY-MM-DD HH,YYYY-MM-DD HH:MM, orYYYY-MM-DD HH:MM:SS.
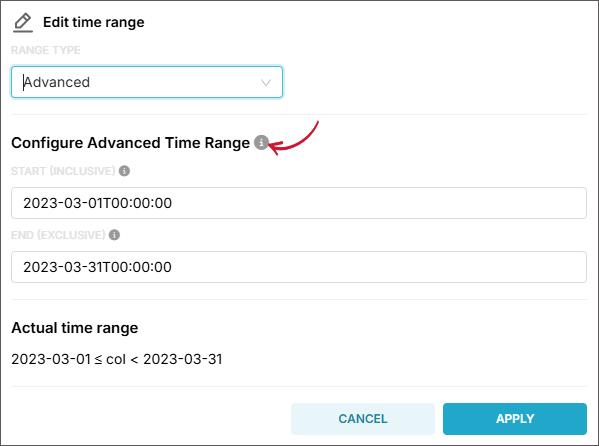 Date Time - Advanced
tipHover the information icon beside Configure Advanced Time Range for examples and guides in setting time ranges.
- Start (inclusive) - it can be
-
When No filter is selected, all available data will be included in fetching.
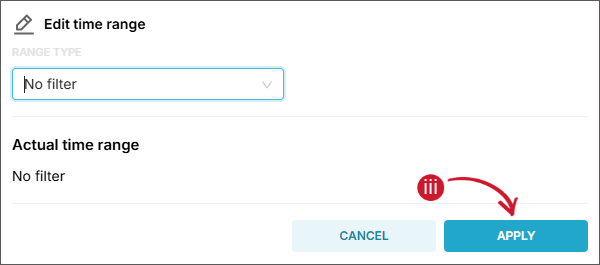 Date Time - No Filter
- Click Apply.
tipUse the Actual time range as a reference when validating the settings.
b. Application Type (required) - name of the grouping in which data types are classified, such as Feature, Handle, and Package.
c. Vendor License (required) - name of the vendor license in each specific type of feature. Multiple selection is allowed.
NOTEThere are other optional filter parameters that you can set, such as Application Name and Application Version. However, it is recommended to use table item selection as the preferred method for filtering, as it aligns best with the dashboard’s interactive design and ensures smoother user experience.
-
Click Apply filters.
Wait until the report has finished processing and is displayed.
Filtering using Table Items
Once the dashboard is generated, you can begin interacting with the charts and visualizations. Each sub-dashboard contains interconnected charts, each designed to serve a specific analytical purpose. These charts are synchronized — applying a filter to one will automatically update the data displayed in the others. This dynamic interaction allows for progressively deeper insights as users explore different data segments.
Tables are the primary method for applying filters across the dashboard. By clicking on an item within a table, you trigger a filter that applies to the entire dashboard.
To apply a filter:
-
In each sub-dashboard, you will find two filterable tables:
- DU per hour across all license servers
- SUM MAX AVG IN Distinct User Hour table
Click on a specific item within any of these tables to apply a filter.
NOTE- Only classification-level items can be selected.
- Only single selections are allowed.
-
Once an item is selected, all related charts across all sub-dashboards will automatically update to reflect the filtered data, ensuring a cohesive and relevant analytical view.
Available Sub-dashboards
Application Distinct User per Hour Summary
A table showing the total number of distinct users for each application. The table supports collapsing to the application level and expanding down to the hourly level.
Use the expand and collapse icon to use the drill-through functionality.
The report includes the following classifications and measurements:
Classifications
| Classification | Description |
|---|---|
| Application Name | Name of the licensed application |
| Year | Year the application is used |
| Month | Month the application is used |
| Day | Day the application is used |
Measurements
| Measurement | Description |
|---|---|
| SUM Distinct user Hour | Total number of distinct users |
DU per hour across all license server
A line chart illustrating the daily count of distinct users across all license servers. If an application is associated with multiple license servers, the chart aggregates the unique users from each server to provide a combined total.
SUM MAX AVG MIN Distinct User Hour Table
A table showing various monthly aggregation of distinct user based on the selected filters.
The report includes the following classification and measurements:
Classifications
| Classification | Description |
|---|---|
| Date Time | Month-level date (YYYY-MM) |
Measurements
| Measurement | Description |
|---|---|
| SUM Distinct User Hour | Total number of distinct users |
| MAX Distinct User Hour | Maximum number of distinct users |
| MIN Distinct User Hour | Minimum number of distinct users |
| AVG Distinct User Hour | Average number of distinct users |
SUM MAX AVG MIN Distinct User Hour Chart
An area chart that visualizes the SUM MAX AVG MIN Distinct User Hour table. This chart helps highlight changes over time and makes it easy to compare different user activity levels.