We’re upgrading your documentation experience!
The new doc website is live at docs.openit.com. This website is now in maintenance-only mode (only critical issues will be addressed).
Explore the new website and send us your feedback!
#
Getting Started
To begin using Open iT, it is advisable to understand its purpose, intended users, appropriate situations for its application, and operational mechanisms. You can familiarize yourself with these details by reading through the provided information or visiting the official website for further exploration.
#
What is Open iT?
The Open iT® Suite of IT asset management tools is designed to meter and report on application, server, storage, database, and service usage across an entire organization, from a total enterprise view down to each individual user.
With Open iT, the user can:
- Get a centralized overview of all the distributed resources in the network
- Observe trends and initiate action to meet upcoming needs
- Obtain high-quality service levels
- Reduce costs
- Plan investments proactively, and
- Discover undesirable usage patterns in the organization's IT infrastructure
Open iT solutions can help improve service levels while reducing costs, eliminating the need to increase investments and manpower to achieve better service. Our solutions also help predict future resource requirements and obtain high-quality service levels by revealing current trends in resource usage along with unexpected problems that drive costs up and service levels down.
The Open iT software and strategic consulting enables customers to gain control over their IT resource use, cut costs and waste, and improve the reliability and performance of their IT assets.
The Open iT Solution
The Open iT Architecture illustrates how Open iT’s TrueUse™ Engine functions as the core of a robust software asset management and license optimization system.
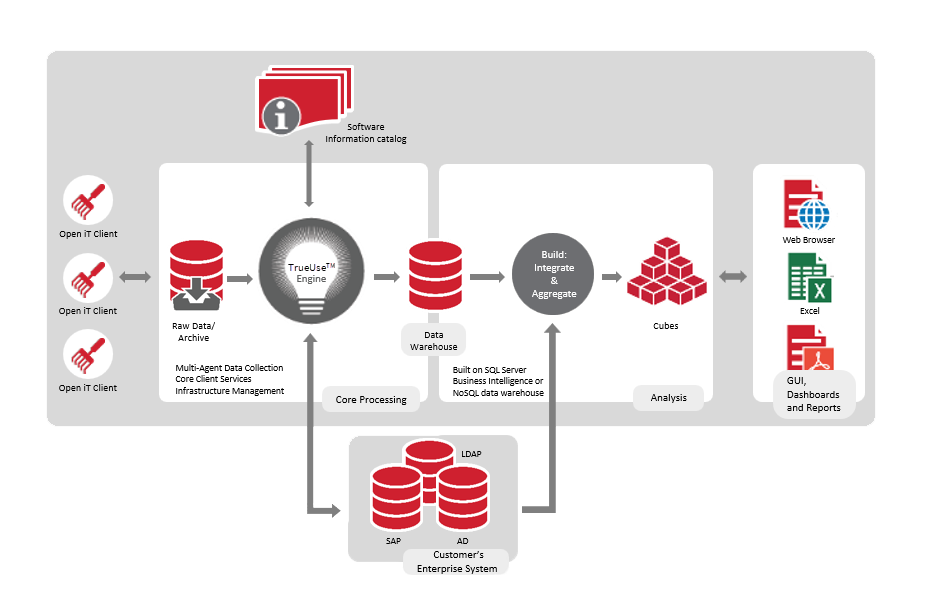
Let's break down its key components and interactions:
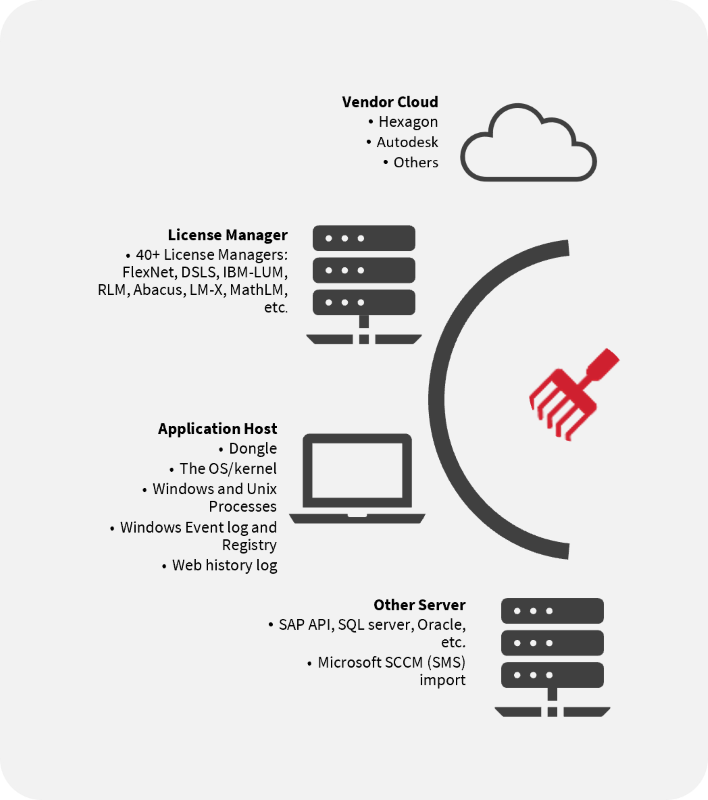
Data Sources
Open iT gathers data from multiple sources to feed into its analytics and simulation engine:
- License Manager
- Supports 40+ types of license managers like FlexNet, DSLS, IBM-LUM, RLM, LM-X, etc.
- Collects usage metrics such as license check-ins/check-outs.
- Application Host - Monitors actual software usage at the OS level using:
- Kernel and process monitoring (Windows & Unix)
- Dongles
- Event logs, registry, and web history
- Other Server Sources - Integrates with:
- SAP API, SQL Server, Oracle
- Microsoft SCCM (SMS) for additional contextual data
- Vendor Cloud
- Connects to vendor systems like Hexagon, Autodesk, and others to gather license and software entitlement data.
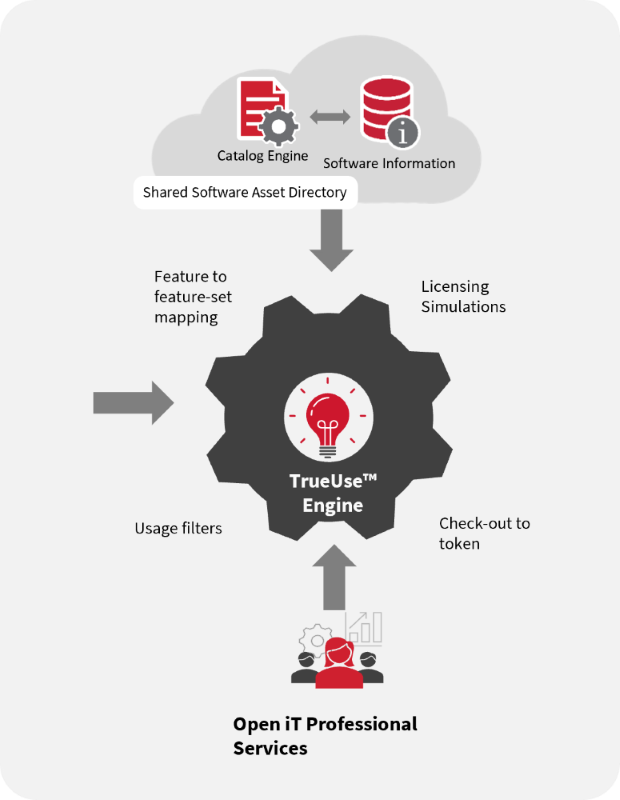
Central Processing
At the heart of the architecture is the TrueUse™ Engine, which processes and analyzes the collected data:
- Shared Software Asset Directory:
- Maintains consistent, centralized software definitions.
- Powered by a Catalog Engine that normalizes and maps data.
- Feature Mapping & Usage Filters:
- Matches actual usage data (from app host and license manager) to license feature sets.
- Applies filters to refine what is counted as legitimate or billable usage.
- Licensing Simulations:
- Models different licensing scenarios, helping organizations test and optimize allocation strategies.
- Check-out to Token Conversion:
- Converts usage patterns into license tokens (e.g., for Autodesk Token-Flex systems).
- Professional Services:
- Open iT provides expert services to support setup, customization, and simulation modeling.
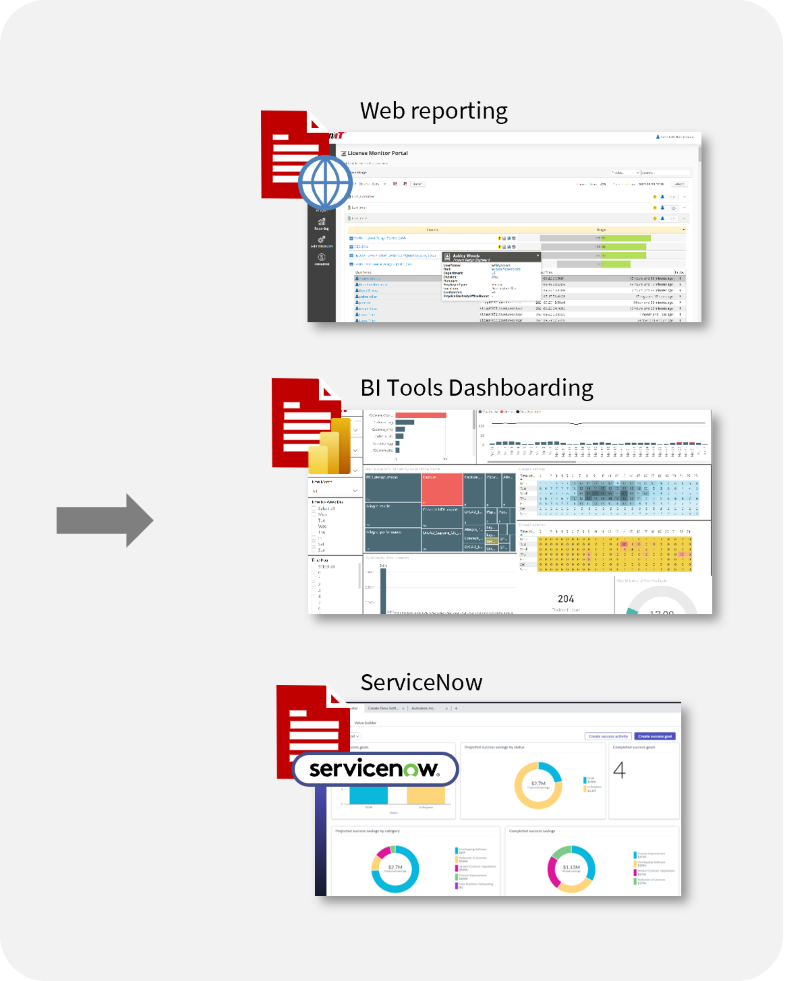
Output & Integrations (Right Side of Diagram)
Once processed, the data can be consumed through various platforms:
- Web Reporting
- Real-time dashboards and reports available through Open iT’s License Monitor Portal.
- BI Tools Dashboarding
- Export and integrate usage metrics into Power BI, Tableau, or similar tools for deep-dive analytics.
- ServiceNow Integration
- Usage and entitlement data can feed into ServiceNow to enhance ITSM and asset management workflows.
Open iT enables complete, detailed, and flexible software usage analytics by:
- aggregating data from multiple technical and licensing environments
- normalizing and enriching it through a central engine
- simulating and reporting results for various stakeholders and platforms
Making it particularly effective for software license optimization, audit readiness, and vendor management across complex IT ecosystems.
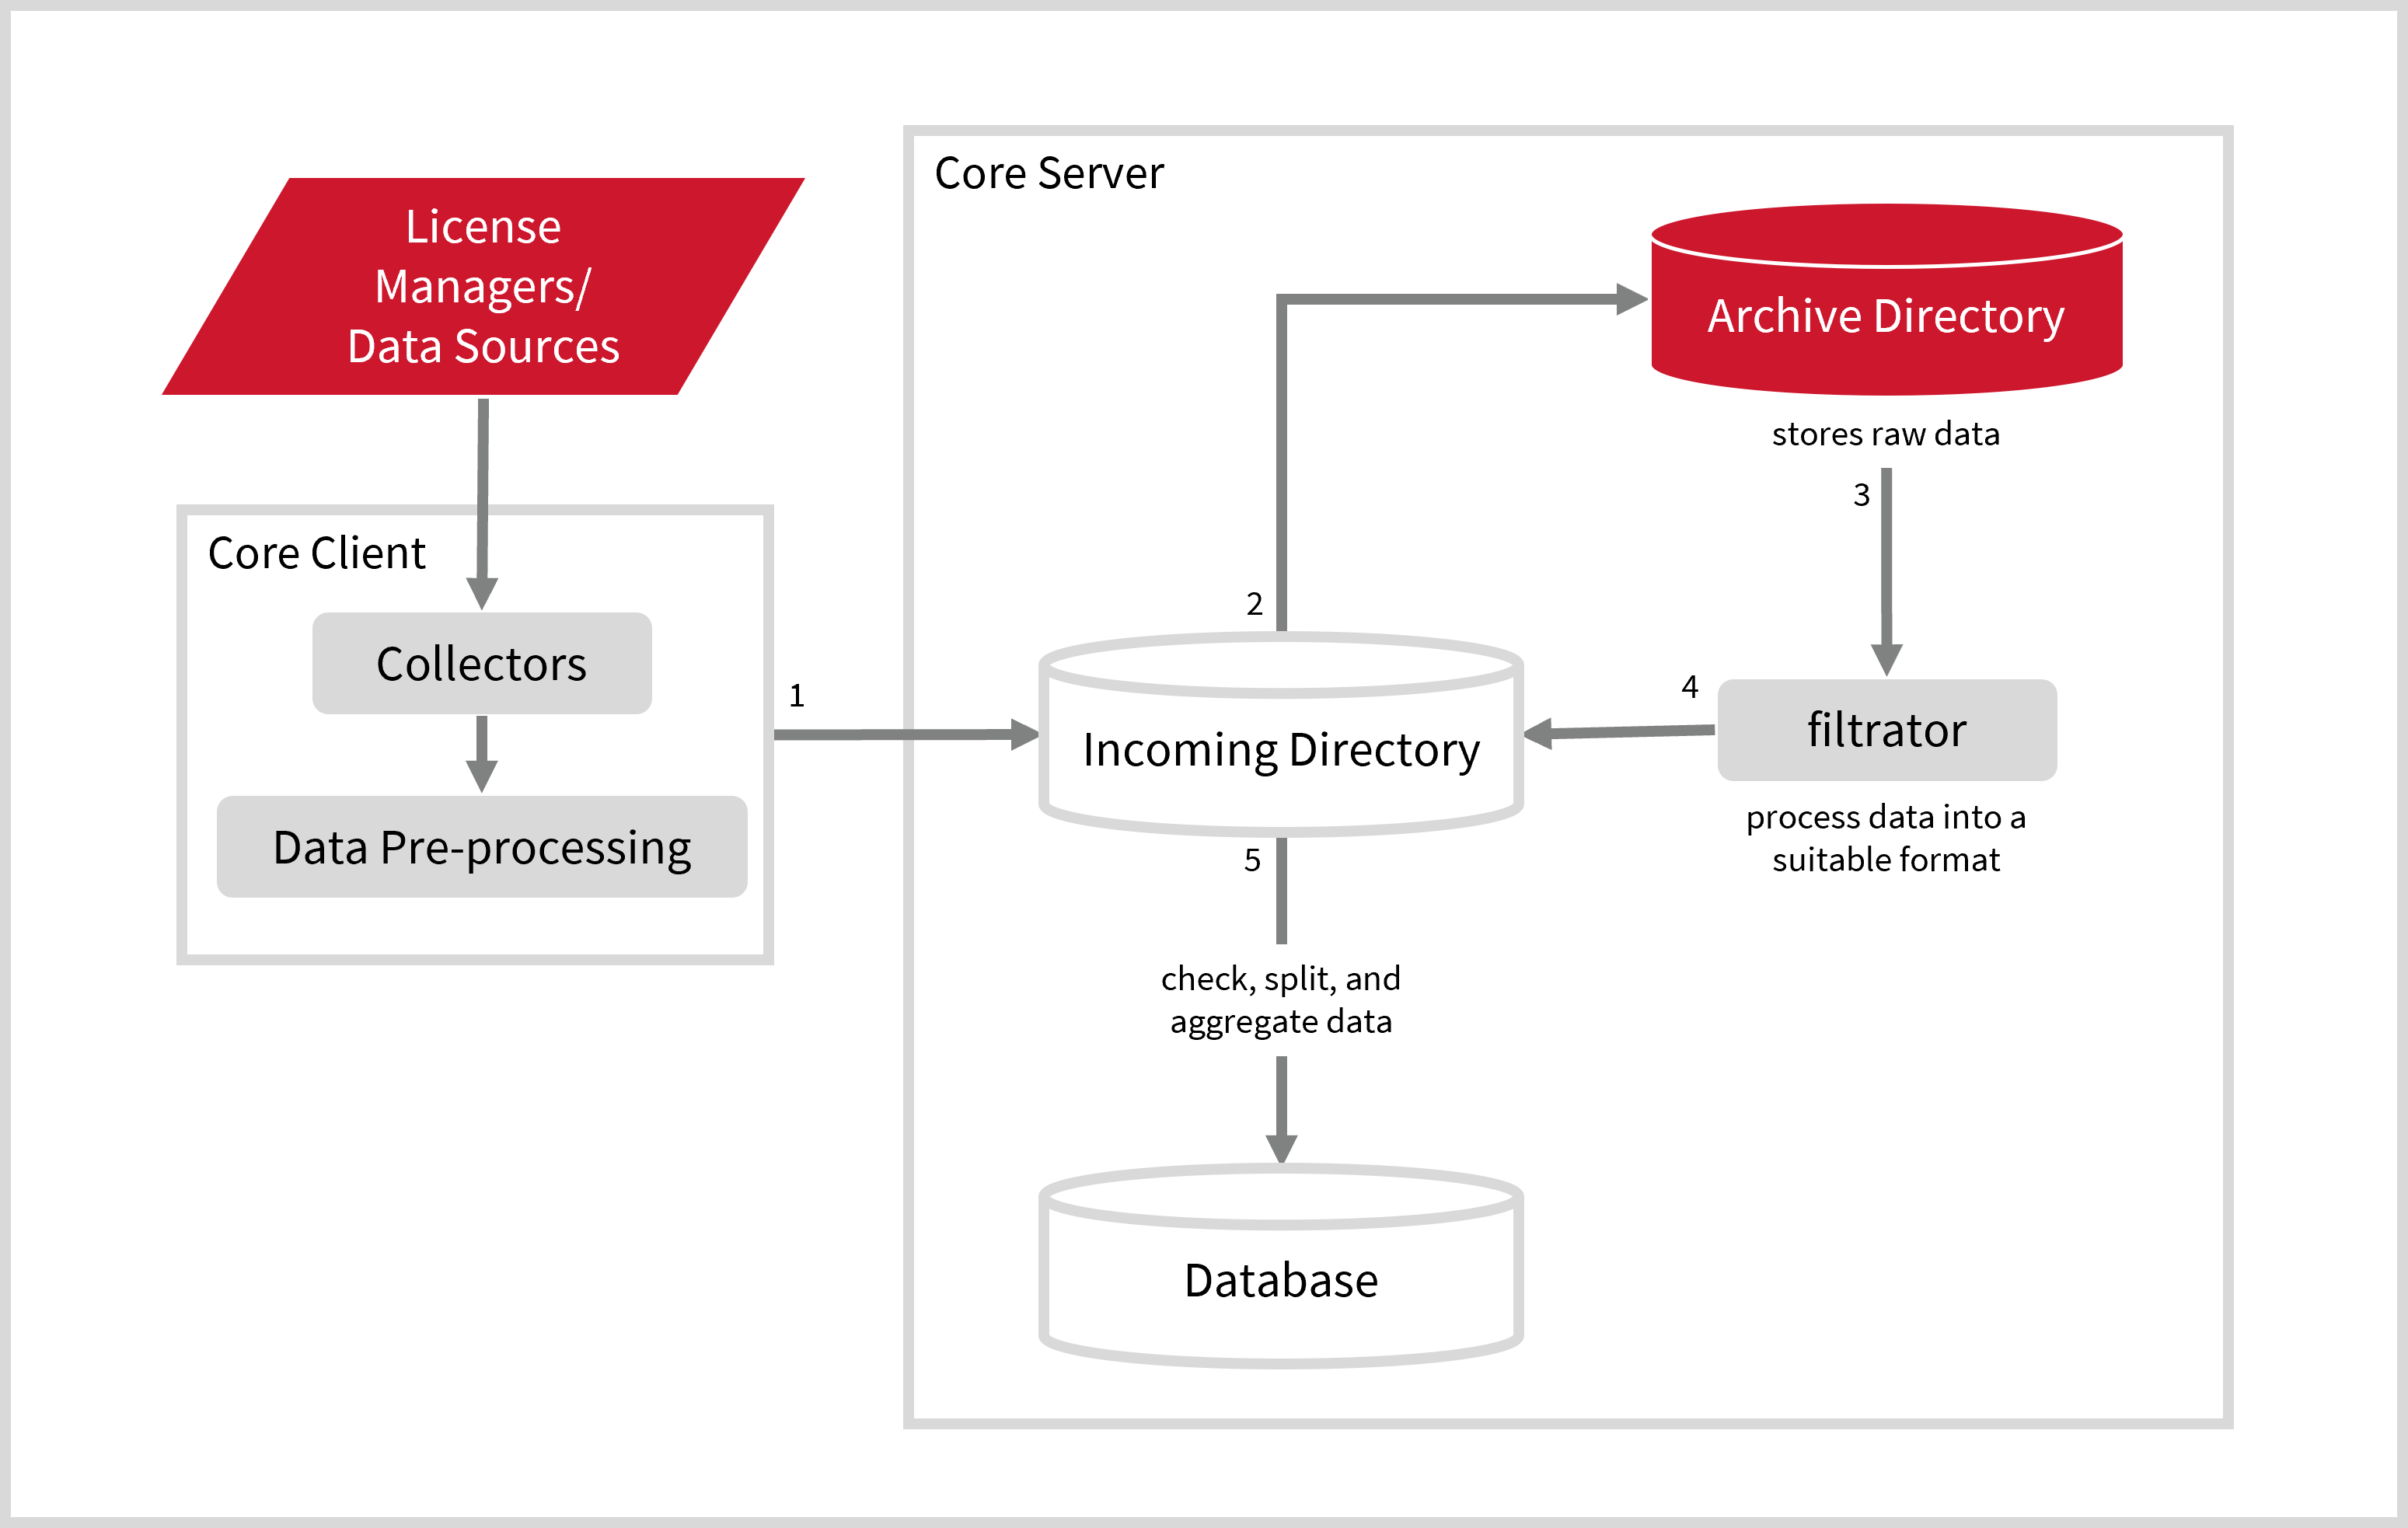
Data Flow
The client converts the raw data collected from the original license manager data source to a format that is readable by Open iT. The client periodically sends the converted data to the server, where it is stored in its incoming directory. The server then processes this data into a reportable format at predefined intervals and finally stores it in its database.
Once the process is completed, the data is ready for report generation. The report generation sequence interacts with the server to retrieve the data needed to generate reports. At this stage, based on the type of report selected from the user interface, report generation programs are run, and the output is written to the specified directories. These reports can then be viewed using a standard web browser.
Quality of Open iT Sampled Data
Open iT data sampling will always give good overall numbers when you have high usage counts. However, as soon as a significant number of checkouts last for a shorter time than our sampling interval, we lose some of the short-term fuzz on the usage curves. We need more samples to catch all of them at the individual user level.
The sampled result will often give good numbers for overall use since usage patterns are not random. Though some local max/min values will happen more randomly, usage will almost always follow fixed trends. For example, users come in the morning; usage rises and peaks in the afternoon, with a dip around lunch and a fall off in the afternoon. Even combining input from multiple time zones/regions does not remove the usage pattern.
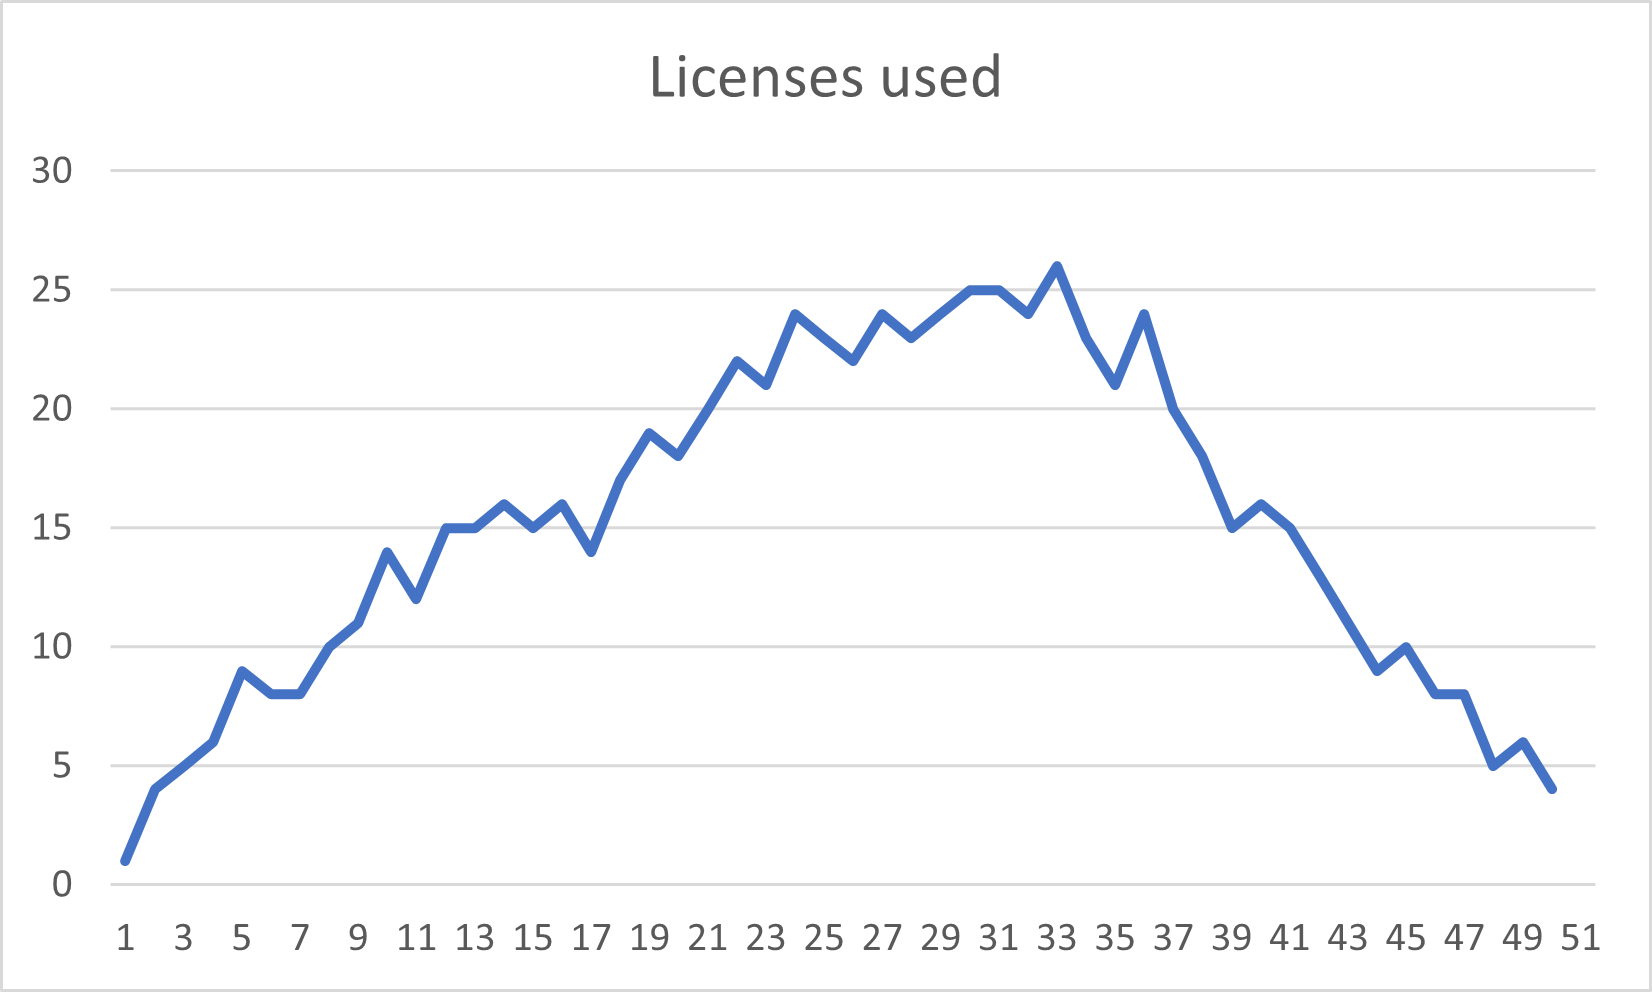
We will not see what happens between each sample point for sampling, so Open iT will miss some maximum and minimum values. However, the overall trend will be seen even with low-frequency sampling. An example may illustrate this better. Below is a chart of values representing the actual usage of a license, where licenses can change at every step.
If we collected samples every 5th of these steps (e.g., 1, 6, 11, etc.), we would see the following usage pattern:
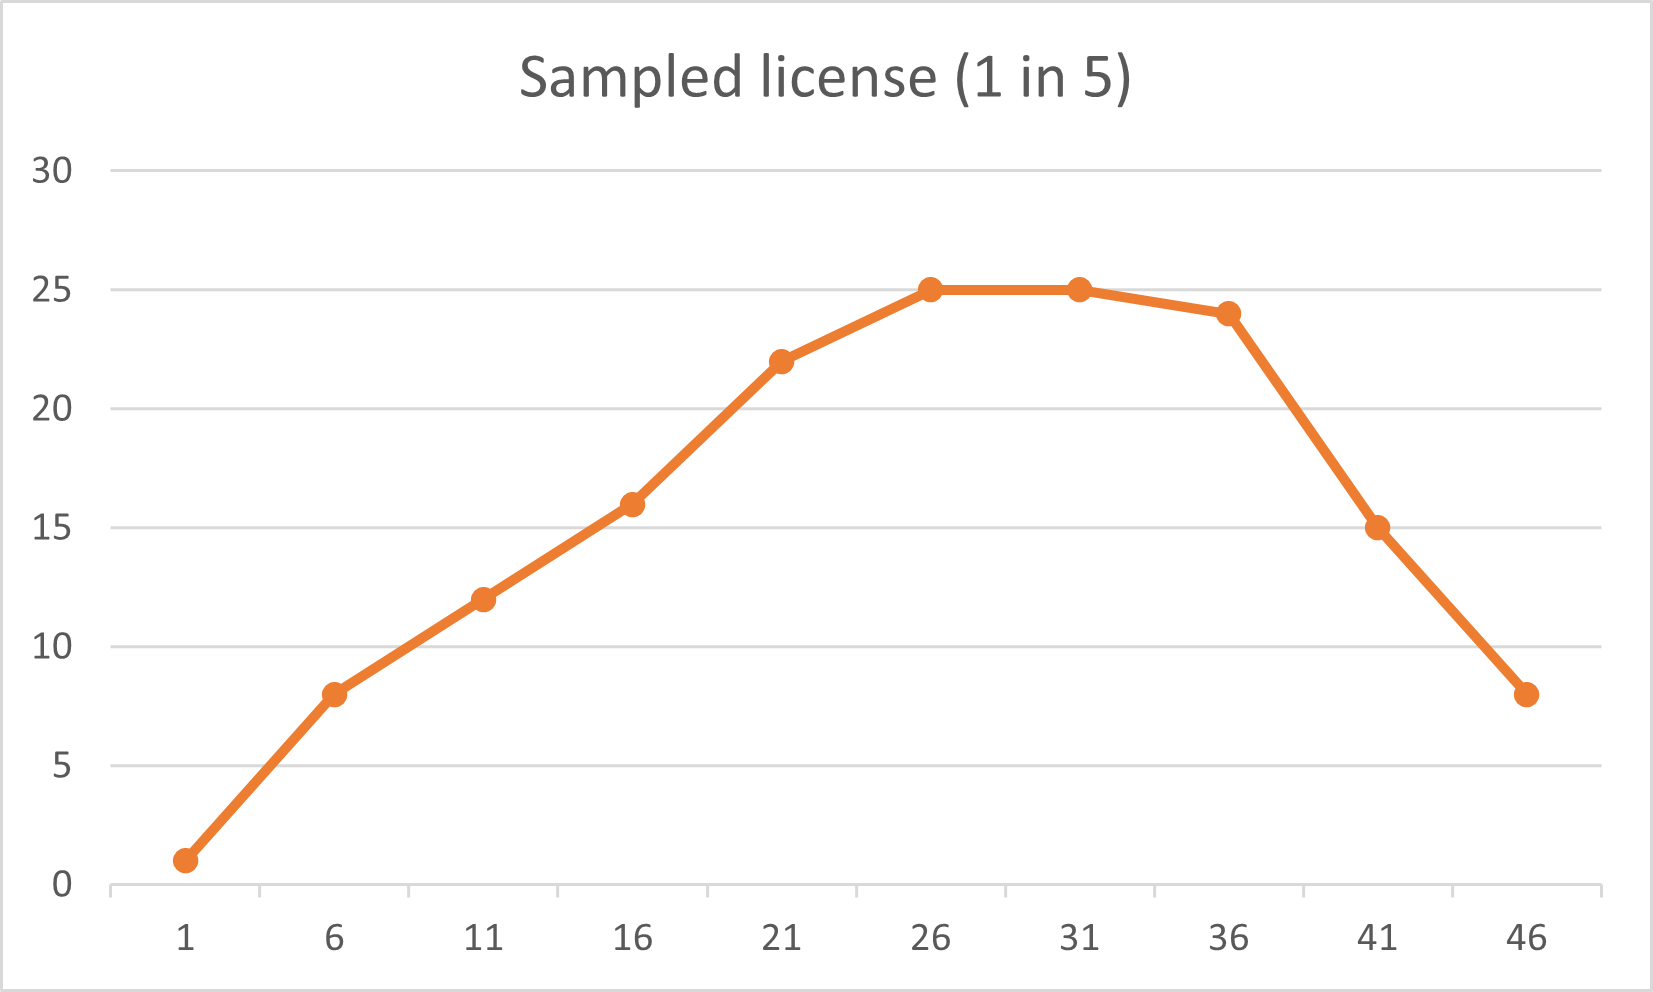
Though the minor variations are missing, we still have a good overview of the general usage pattern.
When we collect usage data, we let each user last as long as the sampling interval and summarize this. Though these numbers are only partially accurate per sample, they will give satisfactory results over time if the missed max/min variation is reasonably random. We will report approximately as much over and underuse as possible, averaging over time.
In the previous example, we would use:
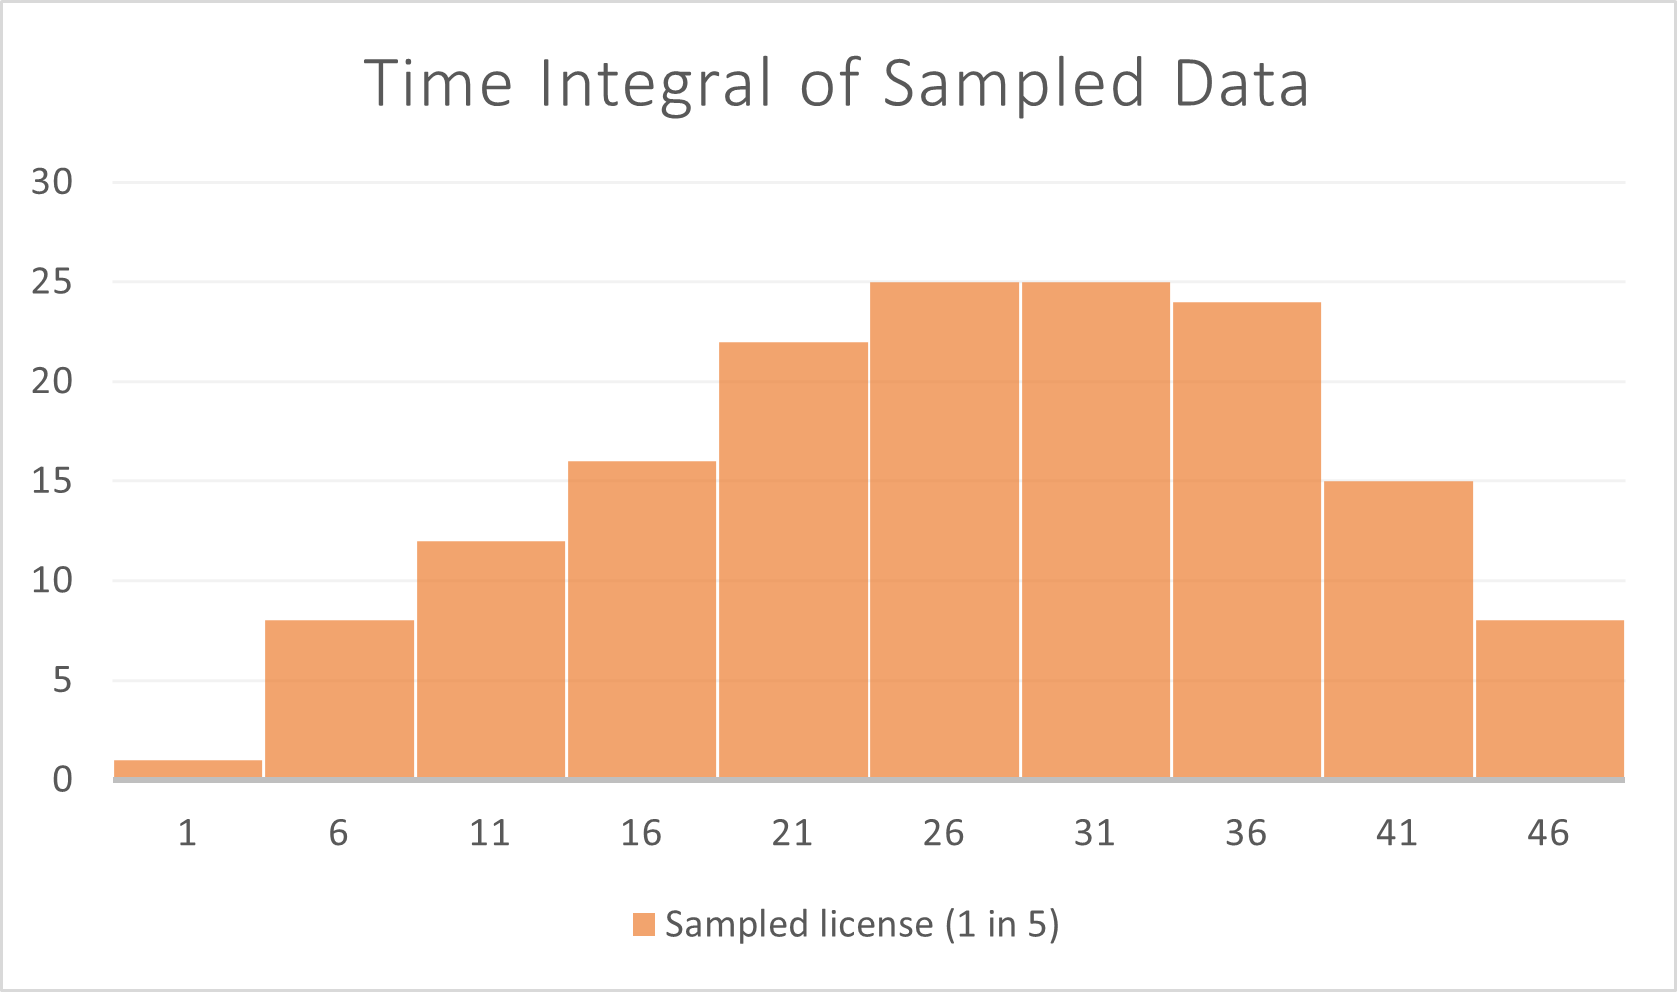
The longer the reporting period covers such data, the more accurate it will be. For example, though a 5-minute value may be measurably wrong, a day report will be pretty good, and a month report will be very close to actual values.
We need to be more careful when reporting data for specific users since we will only see each user occasionally if checkout time is short.
In the first estimate, when the checkout time is 1/N of the polling period, we need, on average, N samples to catch each user. In an extreme case where a particular function is only checked out for a single second every 5 minutes to perform some calculation, our default 5-minute sampling (300 seconds) will need 300 such samples on average to catch the user. Since there are just under 100 sampling periods in an 8-hour working day, we would get a sample of each user one or two times/week. If the function is used less (i.e., just a few times a day instead of every 5 minutes), then most individual users will never be sampled in an average week or month, and the per-user values (max and elapsed time) will be wrong.
On the other hand, if the usage ever reaches the license maximum, all the following samples are likely to show this value or one close to it, so the customer will see the effect of denials.
The Open iT® Suite offers various options for IT asset management and optimization. These options include the Base Professional platform with the Open iT Core Reporter and the Base Enterprise platform, containing both the Open iT Core Reporter and the Analysis Server.
The Open iT clients are set up with module-specific configurations. These configurations include the three levels of the LicenseAnalyzer™ designed for specific usage monitoring of licensed applications and various plugins for added functionalities.
Open iT caters to your specific needs with a variety of Point Solutions for monitoring and management of licensed applications.
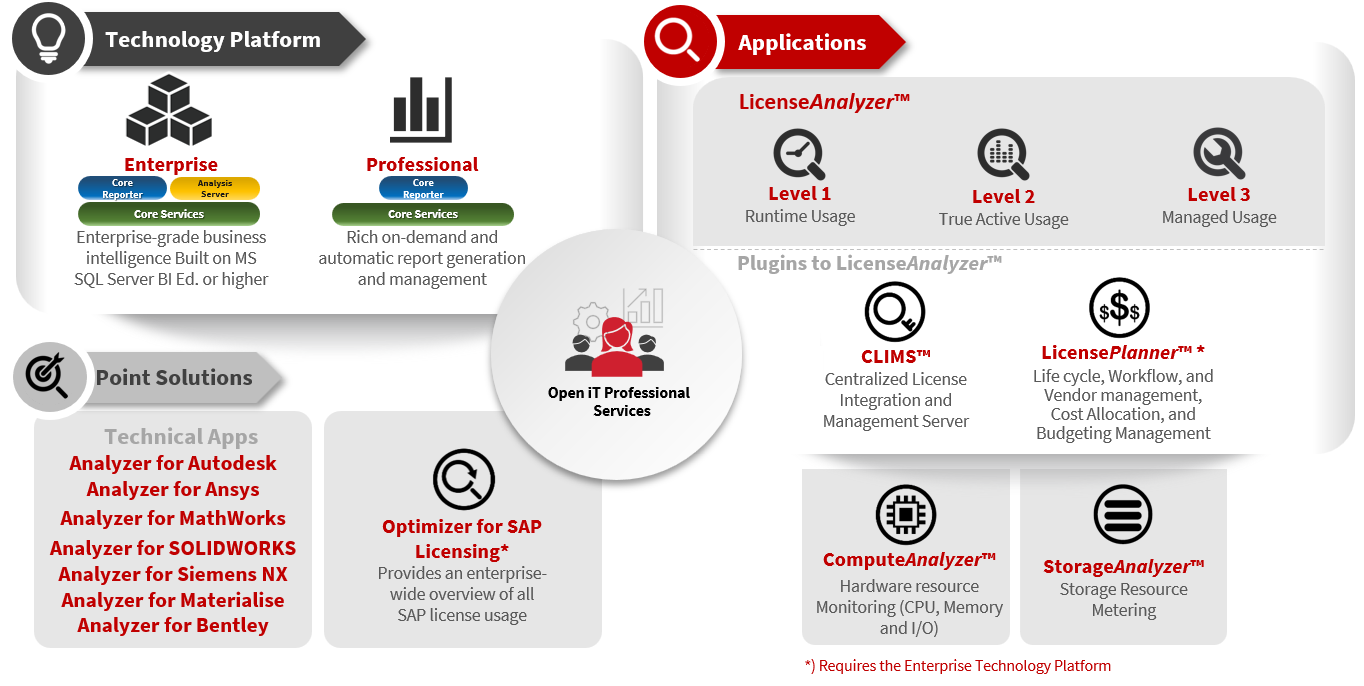
The Open iT Suite offers two technology platforms:
#
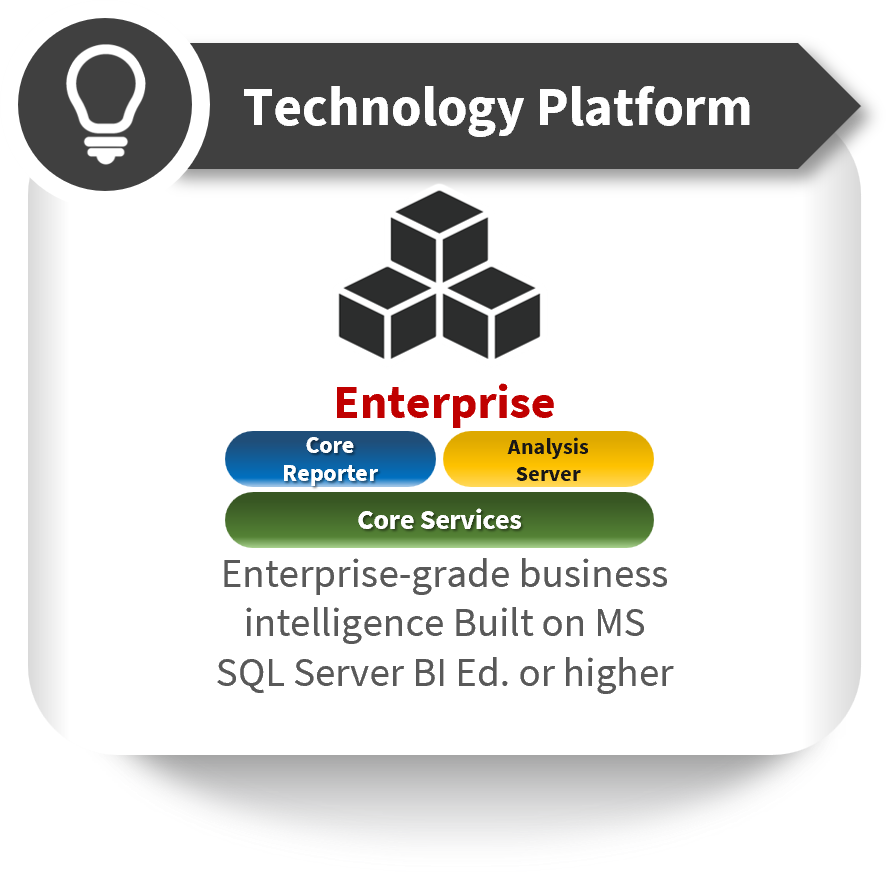
Base Enterprise
The Open iT Base Enterprise is an enterprise-grade platform that offers a wide variety of functionalities for business intelligence. This is built on the Microsoft SQL Server Business Intelligence Edition or higher and is composed of the following resources:
- Core Services
- Core Server Web Interface
- Analysis Server
#
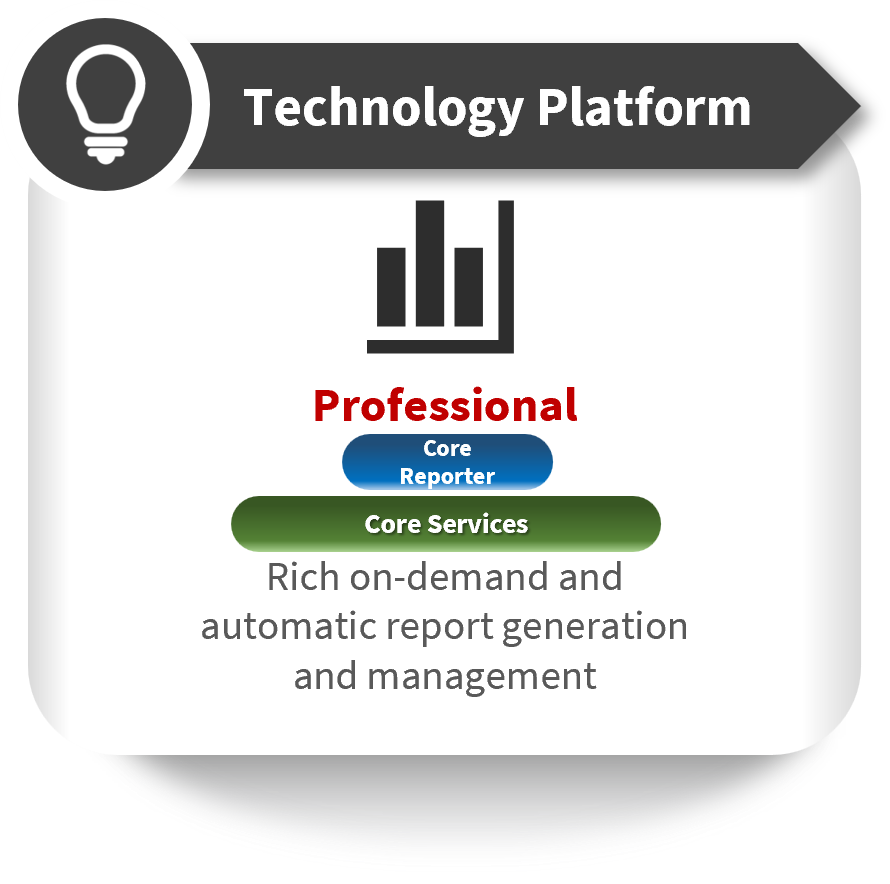
Base Professional
The Open iT Base Professional is a platform that offers rich automatic and on-demand report generation and management. This is composed of the following resources:
- Core Services
- Core Server Web Interface
The following unmodified tools are included in the Open iT software product or used by the Open iT software:
- Apache HTTP server
- Software under the GNU General Public License
- A standard Perl interpreter
- PHP
- Java
- The Zlib data compression library
- The FOX Toolkit
- TinyXML
- Lua
- Python
- cURL
- NSSM
- Caddy
- SQLite
- AutoHotKey
- Amazon Web Services (AWS) Command Line Interface Tool
#
Comparing Different Versions of Open iT
Each Open iT version offers distinct features, enhancements, and capabilities tailored to different user requirements. This section comprehensively compares Open iT versions 9.17, 9.19, 10.0, 10.1, and 10.2, highlighting their differences in features and supported applications and systems to help you make an informed decision.
This comparison assumes that all relevant hotfixes and updates are installed for each version.
#
Feature Comparison
#
Applications and Systems Support
#
Suite Selection
To get started, choose one of the technology platforms and meet the installation prerequisites to effectively set up and configure the components of Open iT.