Level 2 Reports
Inactive Alert
The FreezeMonitor regularly checks if an app hasn't been used. When it detects inactivity for a period longer than the configured timeout, it notifies the user with a pop-up message.
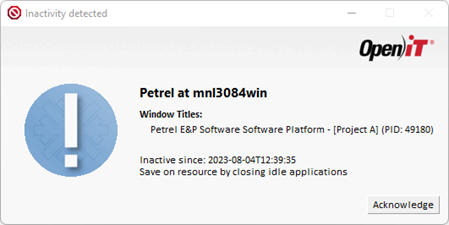
Even if you don't respond to this pop-up, the system will still monitor whether you use the app. If you start using it again and then stop, another pop-up will appear, even if you didn't dismiss the first one.
Core Server
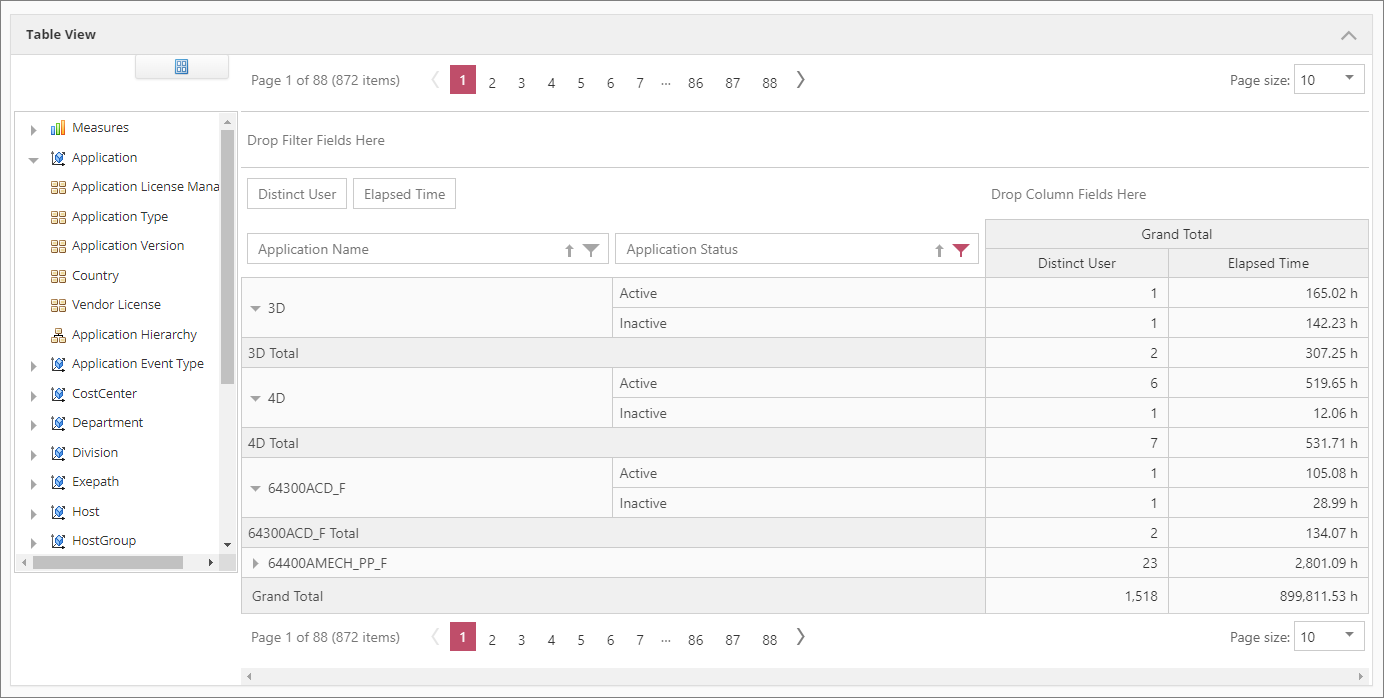
Complete Selection Reports
In the Core Server, one of your options for creating reports is through the Complete Selection. You can generate a variety of reports using Level 2 data types. To create Level 2 reports in the Complete Selection, follow this guide.
Here is a selection of sample generated reports.
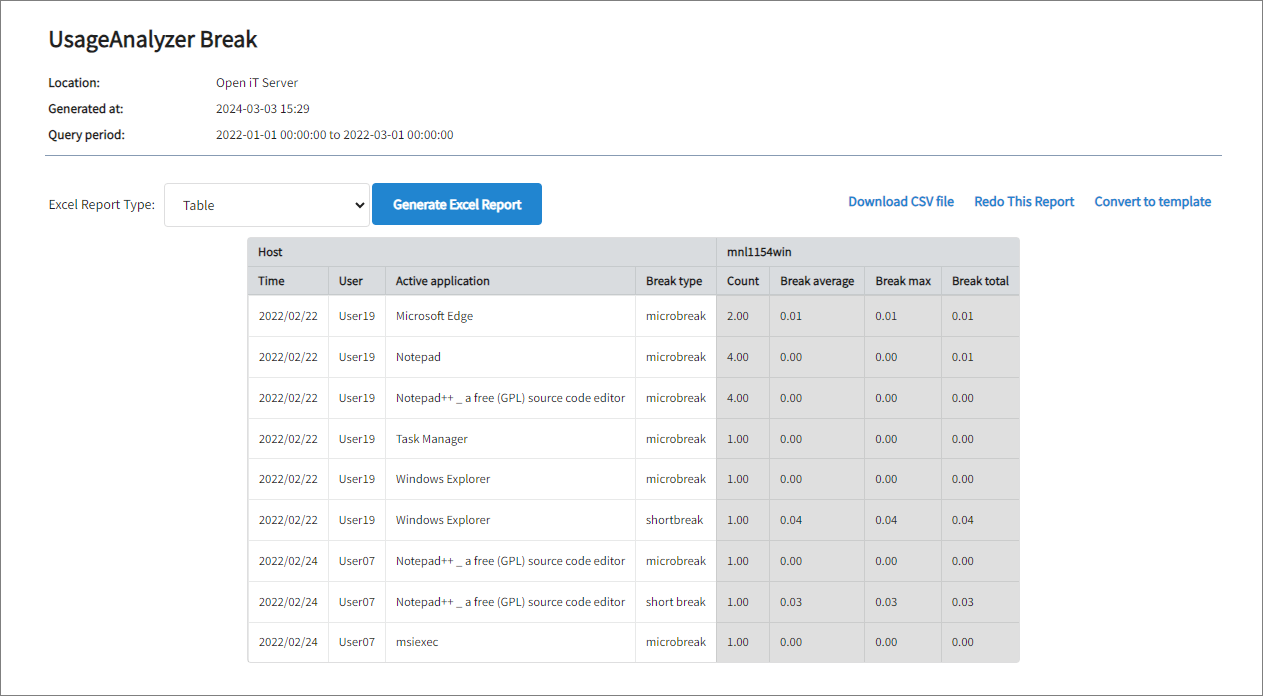
UsageAnalyzer Break Report
This report is generated using data type (56) UsageAnalyzer Break .
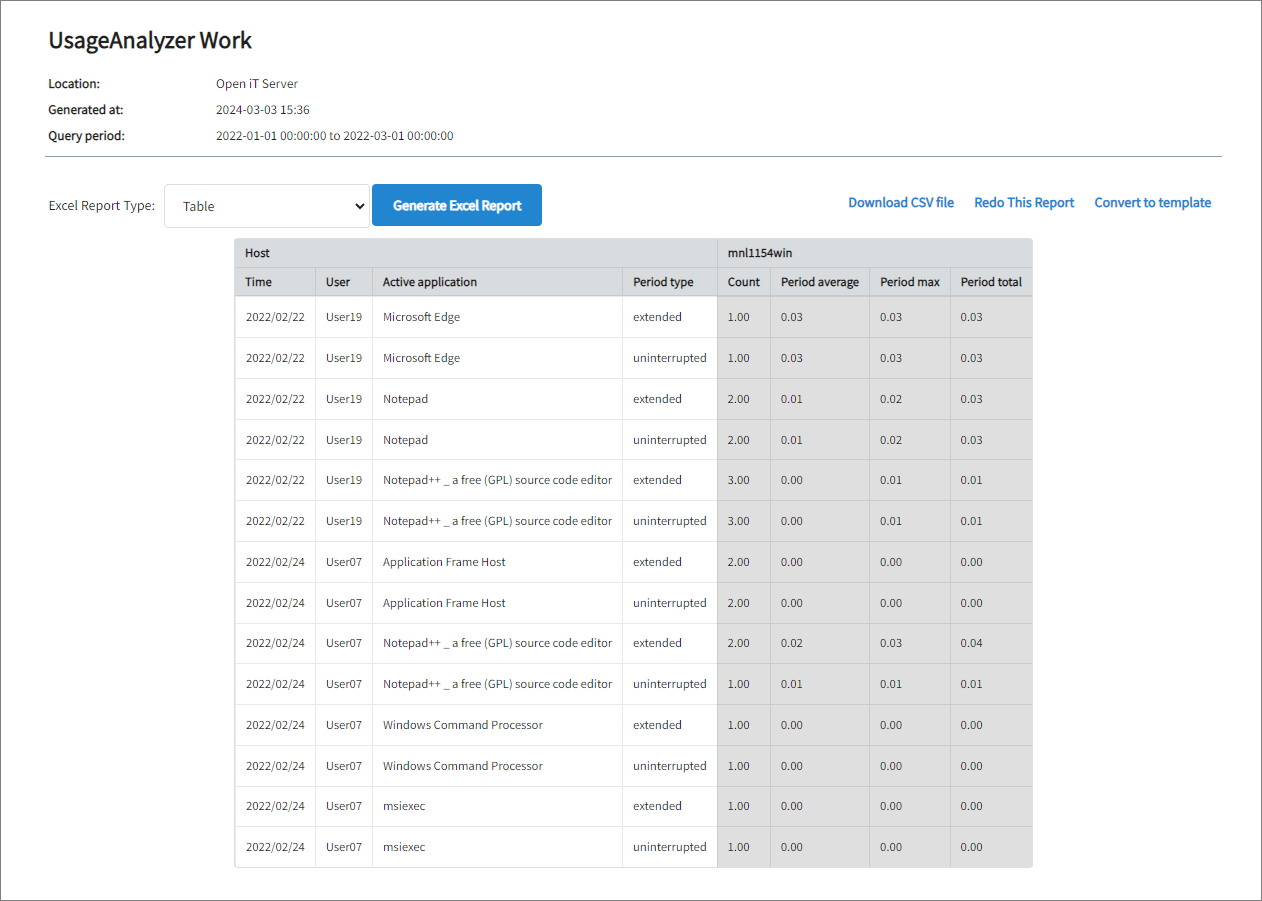
UsageAnalyzer Work Report
This report is generated using data type (57) UsageAnalyzer Work.
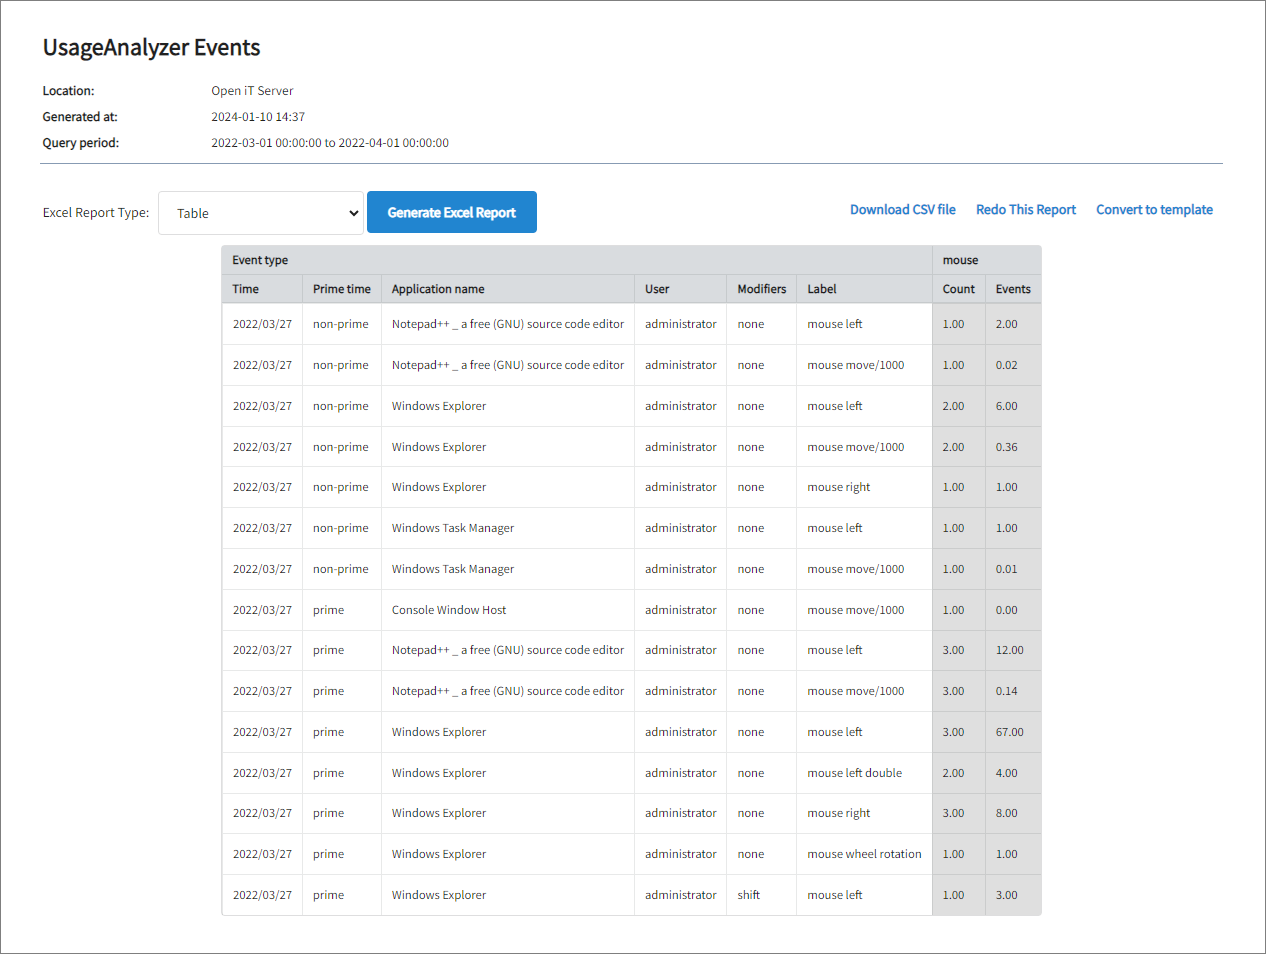
UsageAnalyzer Events Report
This report is generated using data type (58) UsageAnalyzer Events.
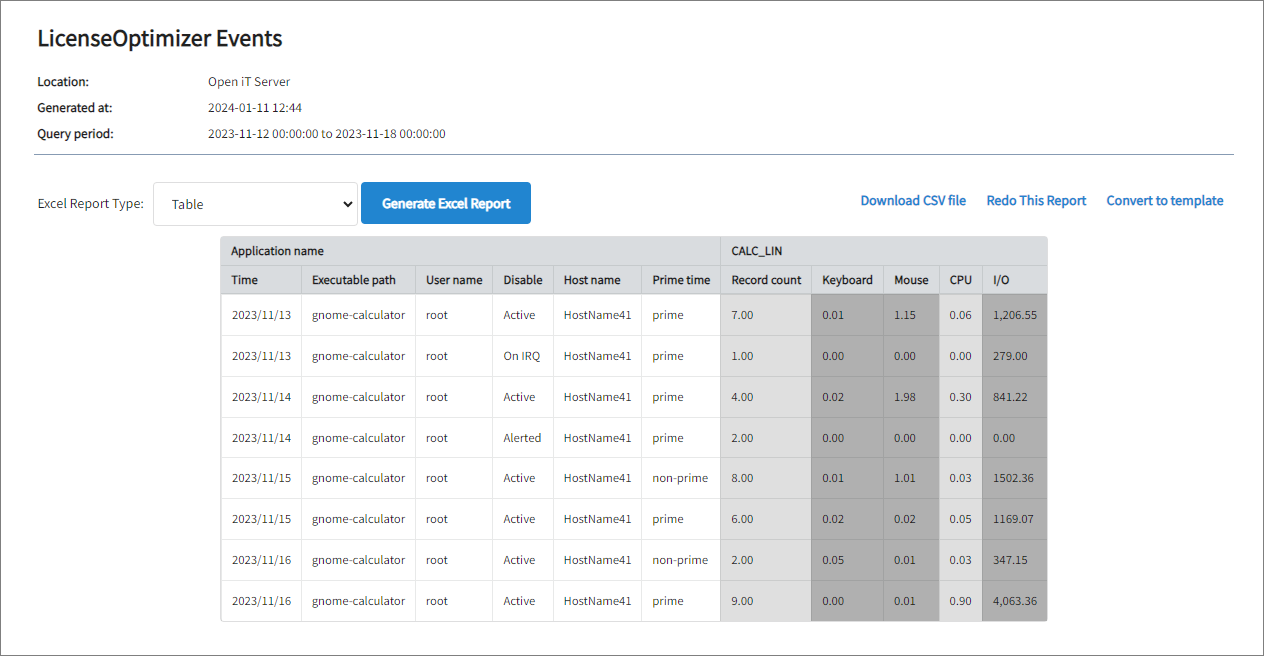
License Optimizer Events
This report is generated using data type (64) License Optimizer Events.
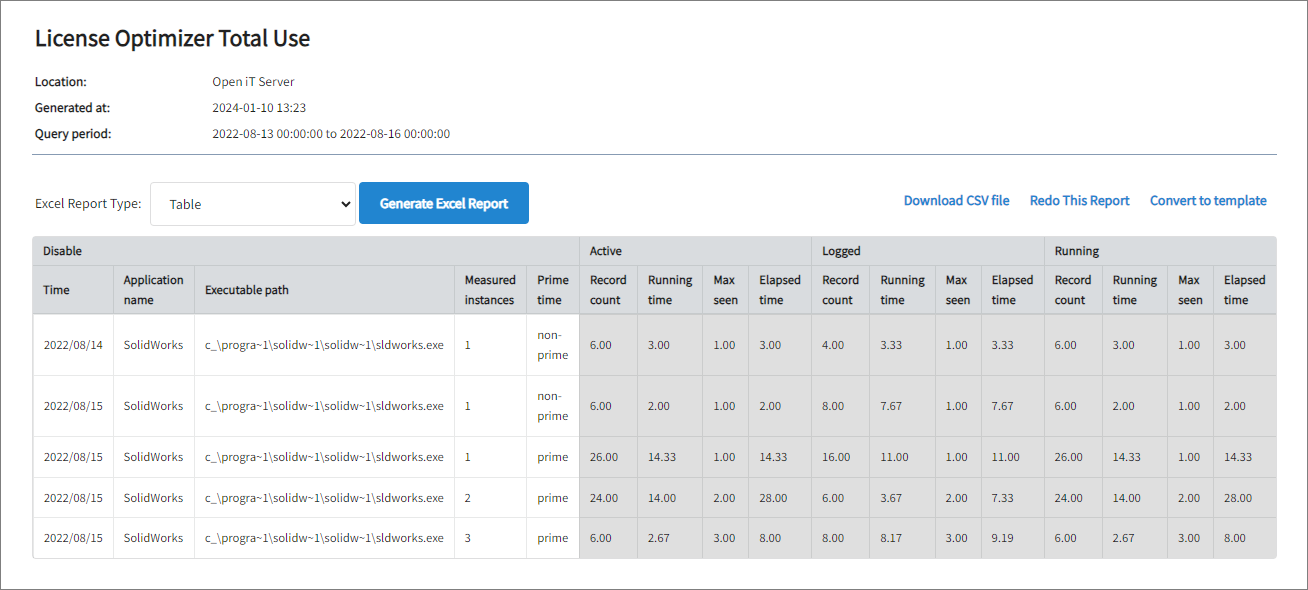
License Optimizer Total Use
This report is generated using data type (70) License Optimizer Total Use.
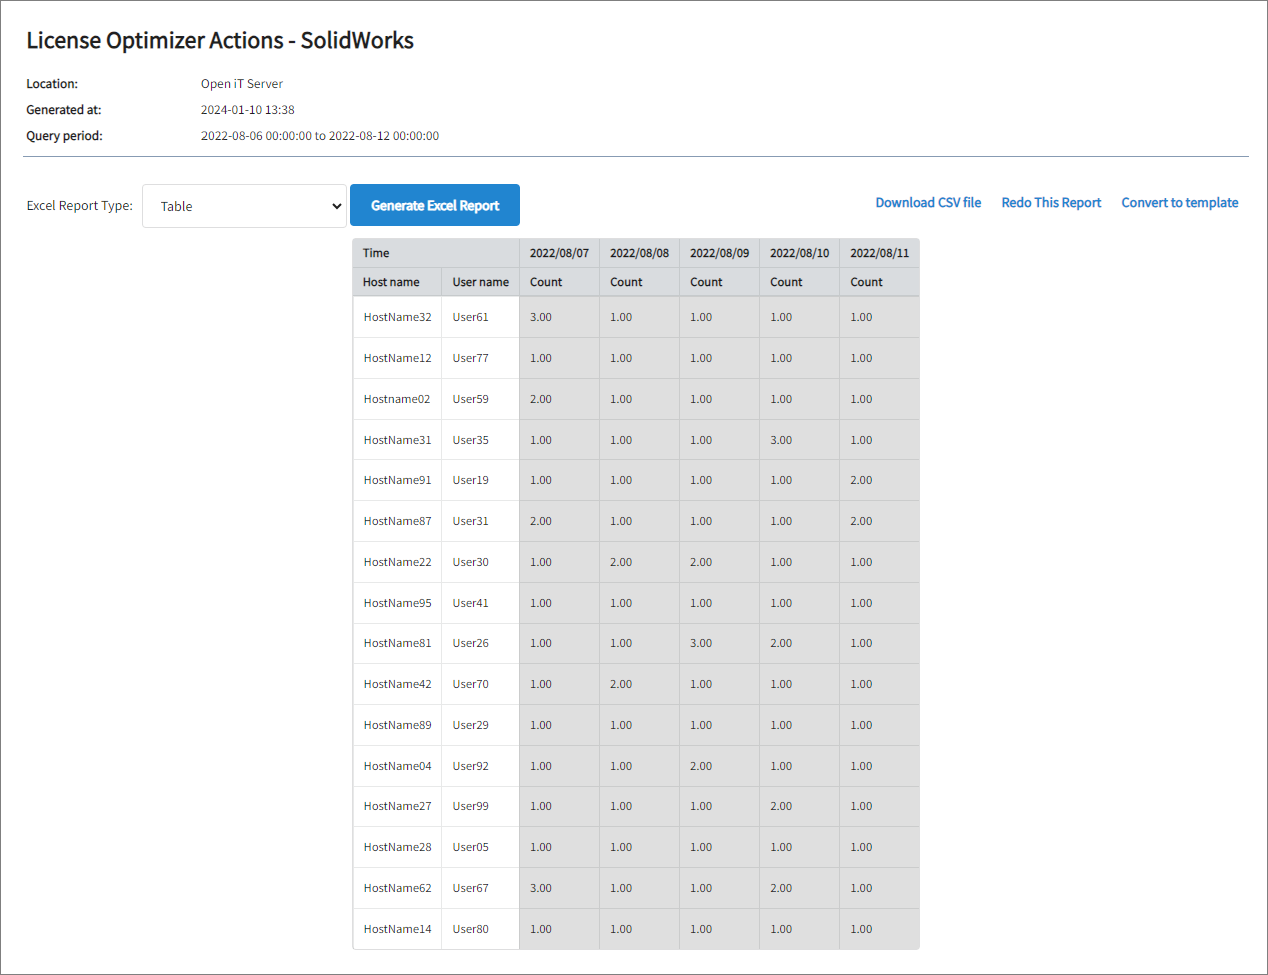
License Optimizer Actions
This report is generated using data type (92) License Optimizer Actions.
Template Selection Reports
The Template Selection page contains reports where the primary selection and presentation styles are defined, and the user only makes a few choices to generate the report. You may follow theGenerating Reports using the Template Selection Tab guide to create a report.
Here are two of the sample reports using data type (0) Unix Pacct:
Not all data types have predefined template reports. You may check the list of available reports per data type here.
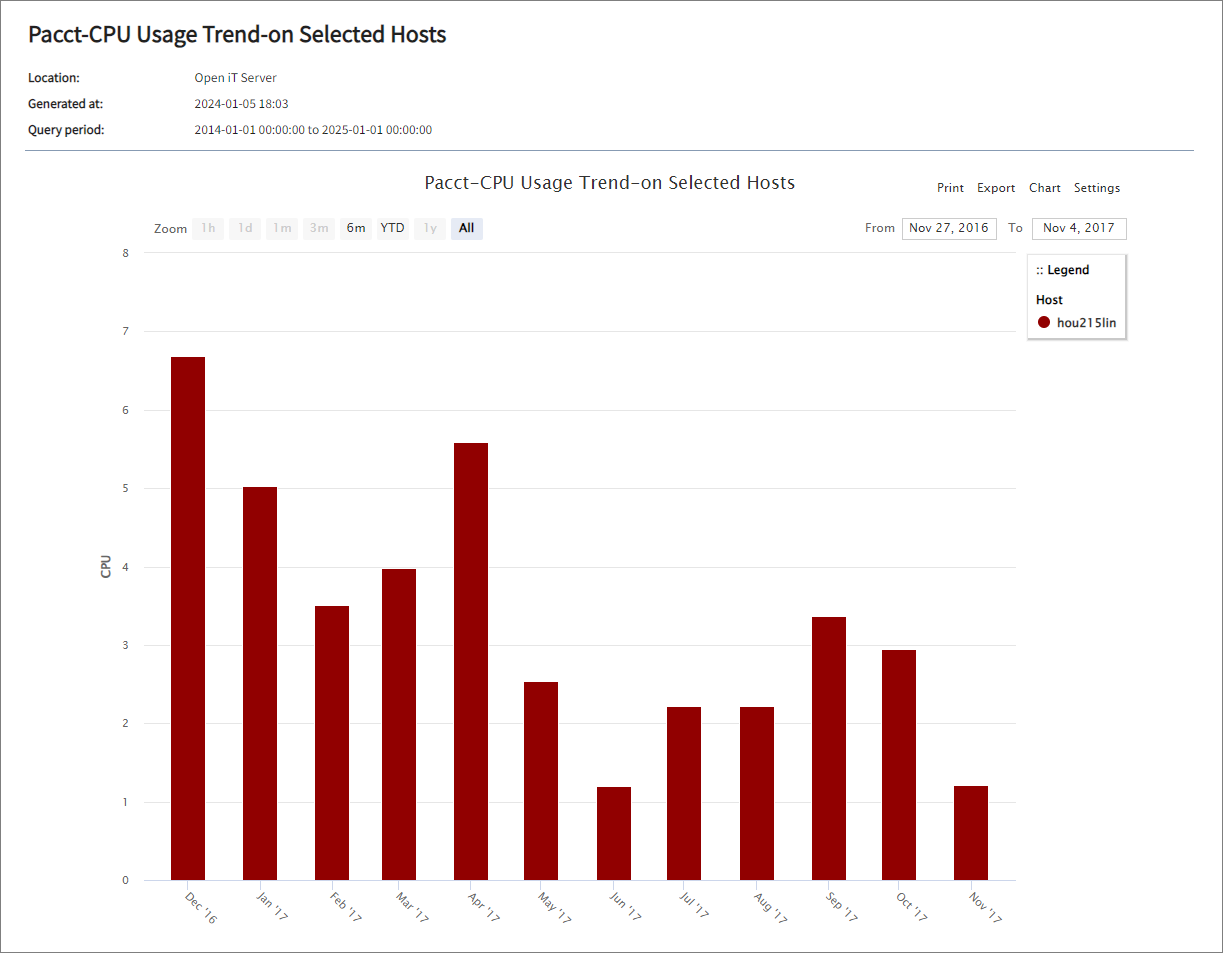
Pacct-CPU Usage Trend-on Selected Hosts
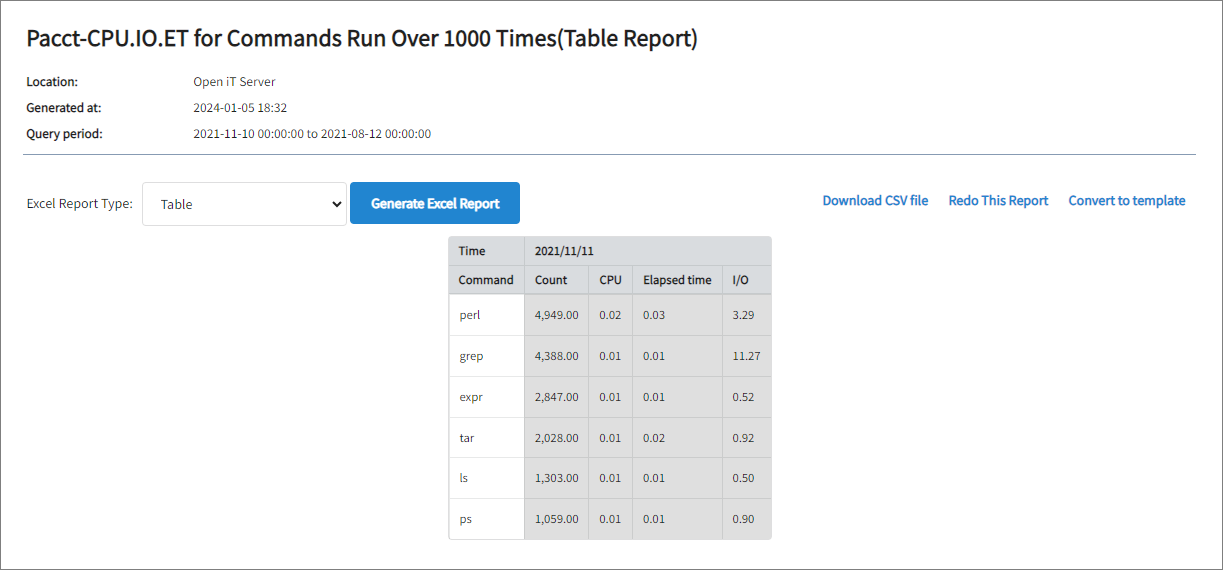
Pacct-CPU.IO.ET for Commands Run Over 1000 Times(Table Report)
Analysis Server
License Monitor Portal
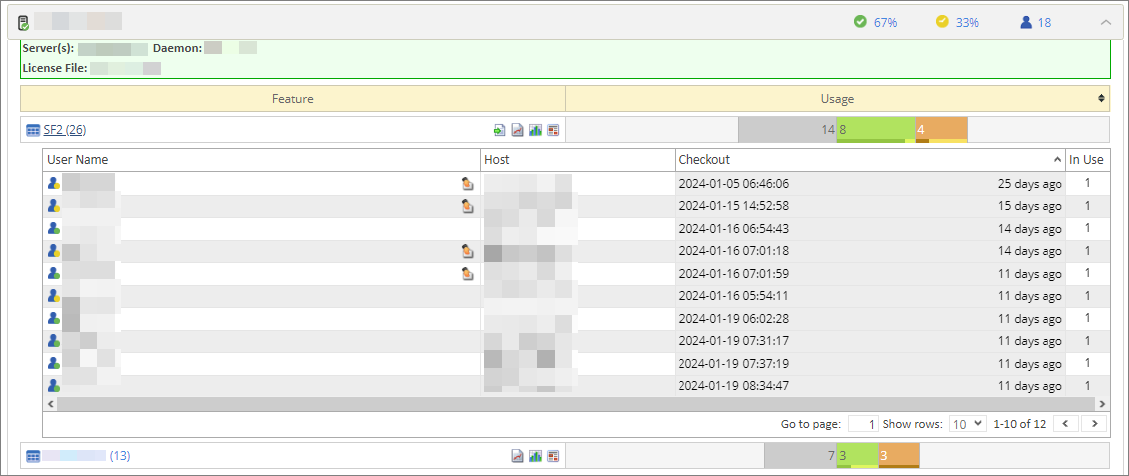
The License Monitor Portal is a real-time monitoring interface that shows data collected from various supported license managers.
In the sample report below, the green check icon, which is 67%, represents the total active usage, while the yellow check icon, 33%, represents the total inactive usage. The smaller progress bar at the bottom of each license usage bar indicates the number of active (darker) and inactive (lighter) licenses.
You may visit the License Monitor Portal section to know more about this page.
SSRS Reports
The Analysis Server SQL Server Reporting services includes pre-configured templates in different presentation structure.
You can check the description of Level 2 SSRS reports and learn how to generate them by clicking on the links below.
Analysis Console Report
You can create your own report based on the available classifications and measurements in the Analysis Console page in the Analysis Server. Follow the Reporting Basics section to create a report tailored to your needs.