Moldex3D License Manager
Introduction
Open iT supports Moldex3D usage reporting by collecting log files and converting them to Open iT format.
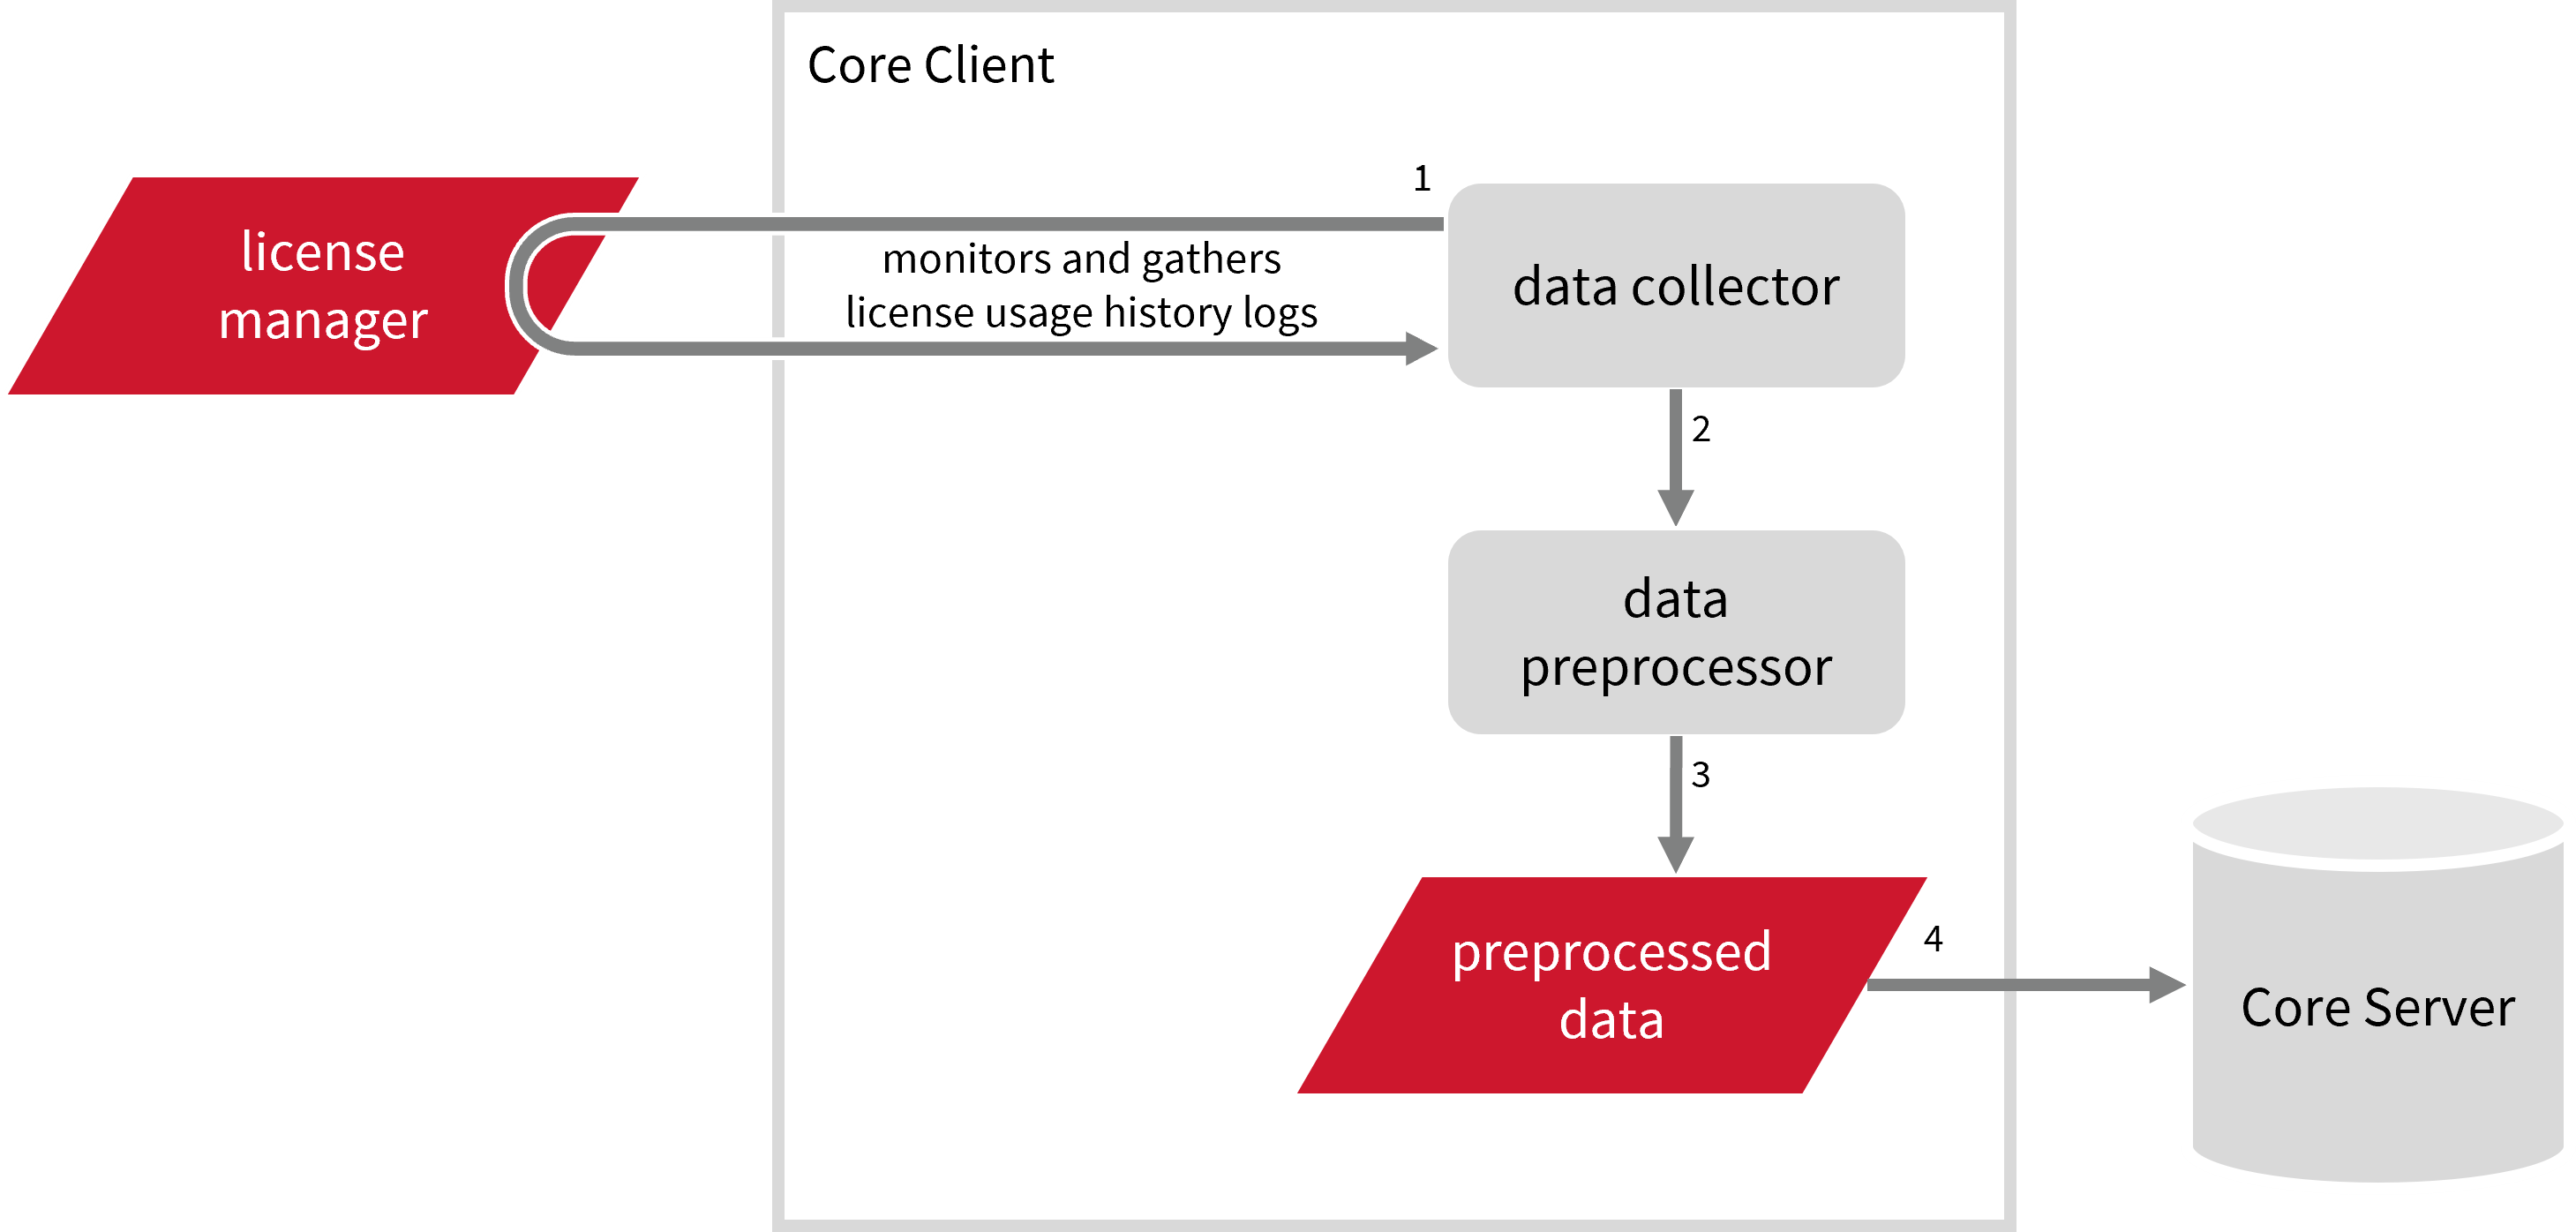
An Open iT Core Client is installed on your license server for this collection. The data collector monitors and gathers the license usage history logs from the license manager hourly. Once the logs are collected, the data collection process triggers and the logs are passed to the data preprocessor. After the data is preprocessed, it is transferred to the Core Server for further storage, completing the history logs collection and processing.
This will produce the following aggregated data types used for historical reporting:
Record Log Data: This will produce the following aggregated data types used for historical reporting:
- (89) Total License Use Licenseevents
- (90) Individual License Use Licenseevents
- (91) Usergroup License Use Licenseevents
- (108) Host License Use Licenseevents
- (109) Hostgroup License Use Licenseevents
Event Log Data:
The following sections will guide you in setting up the necessary configuration to collect and send the required data to the server.
Apply the configurations shown in the Open iT Core Client.
Requirements
- An Open iT Core Client connected to an Open iT Core Server or a coexistent Open iT Core setup
- License server administrative rights
- Full path to the debug log file
Please note that the collected data does not include the number of available licenses. To configure the available licenses for Moldex3D features, refer to the instructions in the Configuring available-licenses.map section.
Configuring Log File Collection
These are the required steps to configure collection of Moldex3D log files.
- Windows
- Unix
-
Go to the Components directory, which is by default in
C:\Program Files\OpeniT\Core\Configuration\Components, and back up thelogfilecollector-moldex3d.xmlfile. -
Open a command prompt with Administrator level privileges.
-
Go to the bin directory, which is by default in
C:\Program Files\OpeniT\Core\bin, run the command:Command Syntaxcd <bin_dir>Examplecd C:\Program Files\OpeniT\Core\bin -
Once in the directory, set the location of the Moldex3D log files, run the command:
Command Syntaxopenit_confinit -c "logfilecollector-moldex3d.logfilecollector.source.dir=<moldex3d_log_dir>"where
<moldex3d_log_dir>is the location of the Moldex3D log files.Exampleopenit_confinit -c "logfilecollector-moldex3d.logfilecollector.source.dir=C:\ProgramData\CoreTechSystem\Moldex3DLMServer\Statistics"
-
Update the configuration file, run the command:
Command Syntaxopenit_confbuilder --clientMake sure no errors are encountered.
Advanced Configuration
Refer to the Moldex3D Log File Collection Configuration table to learn more about Moldex3D configuration in logfilecollector-moldex3d.xml.
| Object Name | Accepted Value | Description |
|---|---|---|
| source.dir | DirName (e.g., C:\ProgramData\CoreTechSystem\Moldex3DLMServer\Statistics) | Location of the Moldex3D log files. |
| source.pattern | String (i.e., *.log) | The glob pattern identifying source files in the source directory. |
| source.seen | String (collect, ignore, or tail) | Seen files are the previously collected source files.
|
| source.cmplines | Integer (e.g., 6, 10, 20) | This is required if the value of source.seen is tail. This is the number of lines compared to source files collected before to determine where to start the collection.Note: If this number is too low, you can end up with an incorrect position, and duplicate data may be in the log files. Usually, it is better to have a few lines more than strictly necessary than even a single line too little. |
| target.dir | DirName (i.e., ${OpeniT.directories.temp}/LogFileCollector) | This is the location of the directory containing the collected log data. |
| target.module | String (i.e., license) | The target type of module (in general). |
| target.datatype | String (i.e., moldex3d) | The specific type of target data. |
| target.interval | Timespan (e.g., P30S, P5M, P1D) | The span of time between collector runs. |
| target.rotation-size | Integer (e.g., 6, 10, 20) | The log file rotates if it goes beyond the number (in mb) defined. |
| target.rotation-glob | String (e.g., *) | The glob pattern to match before the log file rotates. |
-
Go to the Components directory, which is by default in
/var/opt/openit/etc/Components, and back up thelogfilecollector-moldex3d.xmlfile. -
Go to the bin directory, which is by default in
/opt/openit/bin, run the command:Command Syntaxcd <bin_dir>Examplecd /opt/openit/bin -
Once in the directory, set the location of the Moldex3D log files, run the command:
Command Syntax./openit_confinit -r /var/opt/openit/ -d /var/opt/openit/etc/ -c "logfilecollector-moldex3d.logfilecollector.source.dir=<moldex3d_log_dir>"where
<moldex3d_log_dir>is the location of the Moldex3D log files.Example./openit_confinit -r /var/opt/openit/ -d /var/opt/openit/etc/ -c "logfilecollector-moldex3d.logfilecollector.source.dir=/opt/Moldex3D/LicenseServer/Statistics"
-
Update the configuration file, run the command:
Command Syntax./openit_confbuilder --clientMake sure no errors are encountered.
Advanced Configuration
Refer to the Moldex3D Log File Collection Configuration table to learn more about Moldex3D configuration in logfilecollector-moldex3d.xml.
| Object Name | Accepted Value | Description |
|---|---|---|
| source.dir | DirName (e.g., /opt/Moldex3D/LicenseServer/Statistics) | Location of the Moldex3D log files. |
| source.pattern | String (i.e., *.log) | The glob pattern identifying source files in the source directory. |
| source.seen | String (collect, ignore, or tail) | Seen files are the previously collected source files.
|
| source.cmplines | Integer (e.g., 6, 10, 20) | This is required if the value of source.seen is tail. This is the number of lines compared to source files collected before to determine where to start the collection.Note: If this number is too low, you can end up with an incorrect position, and duplicate data may be in the log files. Usually, it is better to have a few lines more than strictly necessary than even a single line too little. |
| target.dir | DirName (i.e., ${OpeniT.directories.temp}/LogFileCollector) | This is the location of the directory containing the collected log data. |
| target.module | String (i.e., license) | The target type of module (in general). |
| target.datatype | String (i.e., moldex3d) | The specific type of target data. |
| target.interval | Timespan (e.g., P30S, P5M, P1D) | The span of time between collector runs. |
| target.rotation-size | Integer (e.g., 6, 10, 20) | The log file rotates if it goes beyond the number (in mb) defined. |
| target.rotation-glob | String (e.g., *) | The glob pattern to match before the log file rotates. |
Moldex3D Events Log File Collection Configuration
This will produce the following aggregated data types used for historical reporting:
Activating Event Log Data Collection
These are the required steps to activate event log data collection.
- Windows
- Unix
-
Open a command prompt with Administrator level privileges.
-
Go to the bin directory, which is by default in
C:\Program Files\OpeniT\Core\bin, run the command:Command Syntaxcd <bin_dir>Examplecd C:\Program Files\OpeniT\Core\bin -
Once in the directory, activate the collection of Moldex3D event log data, run the command:
Command Syntaxopenit_oconfinit -u "collect_license_moldex3d_event-logs.root.scheduler.jobs.collect_moldex3d_licenselogs-events.general.active=true"
-
Go to the bin directory, which is by default in
/opt/openit/bin, run the command:Command Syntaxcd <bin_dir>Examplecd /opt/openit/bin -
Once in the directory, activate the collection of Moldex3D event log data, run the command:
Command Syntax./openit_oconfinit -u "collect_license_moldex3d_event-logs.root.scheduler.jobs.collect_moldex3d_licenselogs-events.general.active=true"
Advanced Configuration
The collection runs every day at 12:00 AM by default. To configure the intervals, locate the instances attribute under collect_moldex3d_licenselogs-events, preprocess_moldex3d_licenselogs-events, or transfer_moldex3d_licenselogs-events in the same file and configure the attributes.
Refer to the Moldex3D Event Log Job Scheduler Instances Configuration table to learn the attributes used to configure Moldex3D events data collection and transfer.
| Attribute Name | Accepted Value | Description |
|---|---|---|
| max-instances | Uint (e.g., 5, 8, 9) | The number of instances allowed to run at the same time. |
| max-handling | String (end-oldest, end-all-old, or end-new) | The action done upon reaching the maximum number of instances:
|
| end-timeout | Timespan (e.g., P30S, P5M, P1H) | The maximum waiting time before terminating a running instance. |
| quarantine | Timespan (e.g., P30S, P5M, P1H) | The waiting time before starting a new instance after a previous one. |
Verifying Event Log Data Collection
After configuration, you can verify that the data is collected and sent to the Core Server by following these steps:
- Windows
- Unix
-
Open a command prompt with Administrator level privileges.
-
Go to the bin directory, which is by default in
C:\Program Files\OpeniT\Core\bin, run the command:Command Syntaxcd <bin_dir>Examplecd C:\Program Files\OpeniT\Core\bin -
Run the command:
Command Syntaxopenit_executor -r collect_license_moldex3d_event-logs -
Verify that there are
archiver*.infiles created in the Core Server's archiver directory, which is by default inC:\ProgramData\OpeniT\Data\incoming\archiver.
-
Go to the bin directory, which is by default in
/opt/openit/bin, run the command:Command Syntaxcd <bin_dir>Examplecd /opt/openit/bin -
Run the command:
Command Syntax./openit_executor -r collect_license_moldex3d_event-logs -
Verify that there are
archiver*.infiles created in the incoming directory in your defined data_dir($ROOT_DATA_DIR)upon Open iT Core Server installation.
Moldex3D Records Log File Collection Configuration
This will produce the following aggregated data types used for historical reporting:
- (89) Total License Use Licenseevents
- (90) Individual License Use Licenseevents
- (91) Usergroup License Use Licenseevents
- (108) Host License Use Licenseevents
- (109) Hostgroup License Use Licenseevents
Activating Record Log Data Collection
These are the required steps to activate record log data collection.
- Windows
- Unix
-
Open a command prompt with Administrator level privileges.
-
Go to the bin directory, which is by default in
C:\Program Files\OpeniT\Core\bin, run the command:Command Syntaxcd <bin_dir>Examplecd C:\Program Files\OpeniT\Core\bin -
Once in the directory, activate the collection of Moldex3D record log data, run the command:
Command Syntaxopenit_oconfinit -u "collect_license_moldex3d_record-logs.root.scheduler.jobs.collect_moldex3d_licenselogs-records.general.active=true"
-
Go to the bin directory, which is by default in
/opt/openit/bin, run the command:Command Syntaxcd <bin_dir>Examplecd /opt/openit/bin -
Once in the directory, activate the collection of Moldex3D record log data, run the command:
Command Syntax./openit_oconfinit -u "collect_license_moldex3d_record-logs.root.scheduler.jobs.collect_moldex3d_licenselogs-records.general.active=true"
Advanced Configuration
The collection runs every day at 12:00 AM by default. To configure the intervals, locate the instances attribute under collect_moldex3d_licenselogs-records, preprocess_moldex3d_licenselogs-records, or transfer_moldex3d_licenselogs-records in the same file and configure the attributes.
Refer to the Moldex3D Record Log Job Scheduler Instances Configuration table to learn the attributes used to configure Moldex3D records data collection and transfer.
| Attribute Name | Accepted Value | Description |
|---|---|---|
| max-instances | Uint (e.g., 5, 8, 9) | The number of instances allowed to run at the same time. |
| max-handling | String (end-oldest, end-all-old, or end-new) | The action done upon reaching the maximum number of instances:
|
| end-timeout | Timespan (e.g., P30S, P5M, P1H) | The maximum waiting time before terminating a running instance. |
| quarantine | Timespan (e.g., P30S, P5M, P1H) | The waiting time before starting a new instance after a previous one. |
Verifying Record Log Data Collection
After configuration, you can verify that the data is collected and sent to the Core Server by following these steps:
- Windows
- Unix
-
Open a command prompt with Administrator level privileges.
-
Go to the bin directory, which is by default in
C:\Program Files\OpeniT\Core\bin, run the command:Command Syntaxcd <bin_dir>Examplecd C:\Program Files\OpeniT\Core\bin -
Run the command:
Command Syntaxopenit_executor -r collect_license_moldex3d_record-logs -
Verify that there are
archiver*.infiles created in the Core Server's archiver directory, which is by default inC:\ProgramData\OpeniT\Data\incoming\archiver.
-
Go to the bin directory, which is by default in
/opt/openit/bin, run the command:Command Syntaxcd <bin_dir>Examplecd /opt/openit/bin -
Run the command:
Command Syntax./openit_executor -r collect_license_moldex3d_record-logs -
Verify that there are
archiver*.infiles created in the incoming directory in your defined data_dir($ROOT_DATA_DIR)upon Open iT Core Server installation.
Sample Reports
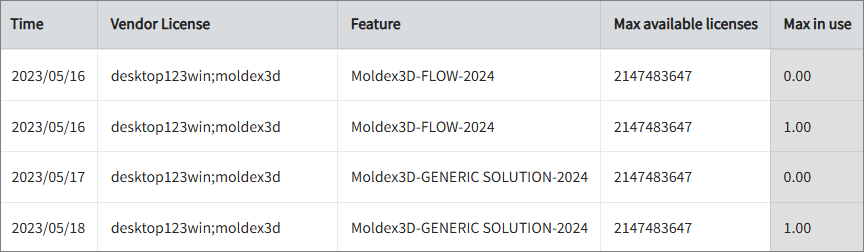
Max Available vs Max in Use
This sample report compares max in-use licenses against max available licenses.
It offers several key benefits:
- Optimized License Allocation – helps ensure you are not over-purchasing licenses you don't need or under-provisioning.
- Cost Savings – identifies opportunities to downgrade or redistribute licenses, reducing unnecessary expenses.
- Usage Trends & Capacity Planning – shows peak usage patterns, allowing better forecasting for future needs.
- Avoiding Service Disruptions – helps prevent situations where users cannot access software due to reaching the license limit.
- Compliance & Audit Readiness – provides a usage record to ensure compliance with vendor agreements and avoid penalties.
- Performance & Productivity Insights – helps assess whether certain teams or departments are under-utilizing or over-utilizing software.
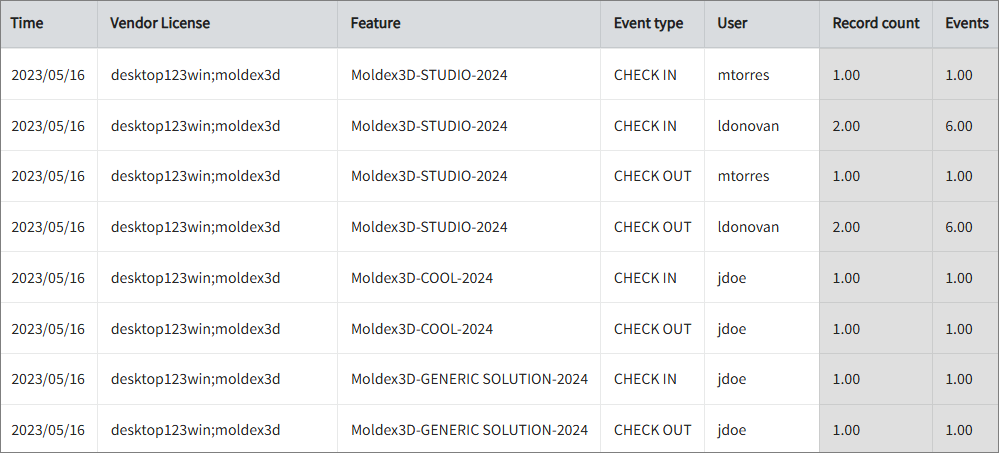
License Usage and Event Logs
This sample report shows the usage and event log of a feature.
It offers several key benefits:
- Optimize Software Spend – identify underutilized or overutilized licenses to right-size your license pool and reduce unnecessary costs.
- Gain Real-Time Visibility – track check-in/check-out events, user activity, and license usage in real-time for better operational insight.
- Ensure License Compliance – maintain audit readiness with detailed logs showing user, host, event type, and time.
- Enhance Engineering Productivity – pinpoint license bottlenecks that hinder development workflows and ensure critical tools are always available when needed.
- Improve Decision-Making – use usage data to forecast demand and plan renewals, upgrades, or reallocations with confidence.
- User Accountability – easily track individual user access to promote responsible software usage and identify training needs.
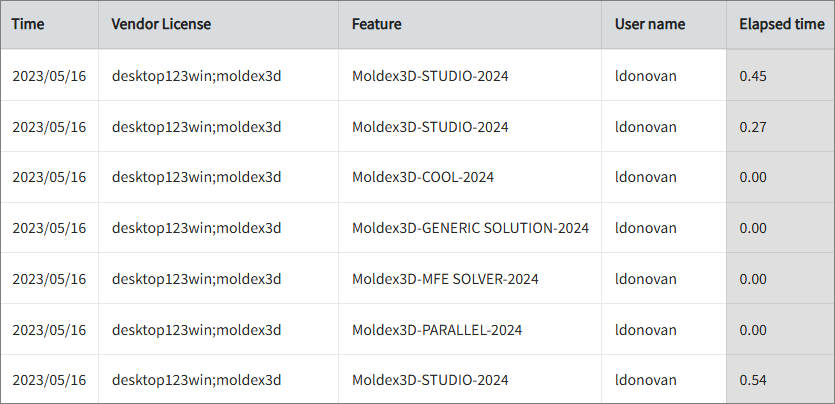
Feature Elapsed Time per User
This sample report gives you helpful insights into software use, performance trends, and user behavior.
It offers several key benefits:
- User Efficiency Analysis – tracks how much time users spend on specific features to help assess productivity.
- Identifying Workflow Issues – highlights any delays or inefficiencies in processes that could be improved.
- Usability & UX Insights – points out features that take longer to use, which could indicate design or functionality improvements.
- Training & Support Guidance – helps identify users who might need extra training to use a feature more effectively.
- Compliance Tracking – makes sure users are spending the right amount of time on regulated tasks.
- Resource & License Optimization – finds underused features or areas where too much time is spent, helping with better resource allocation.