Template Selection
Template Selection allows the use of templates to create Open iT reports. It contains reports where the primary selection and presentation styles are defined, and the user makes only a few choices to generate the report.
The main difference between Template Selection and advanced reporting using Complete Selection is that the Selection tab in the former lists out the reports, and depending on the report selected, the Input tab gets activated or deactivated for inputs. Since the presentation style is already defined, the Presentation tab is not available in Template Selection.
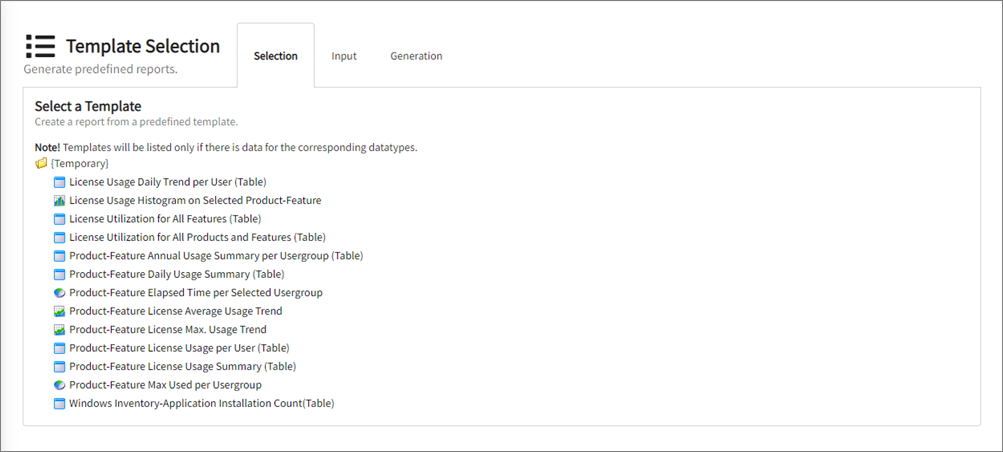
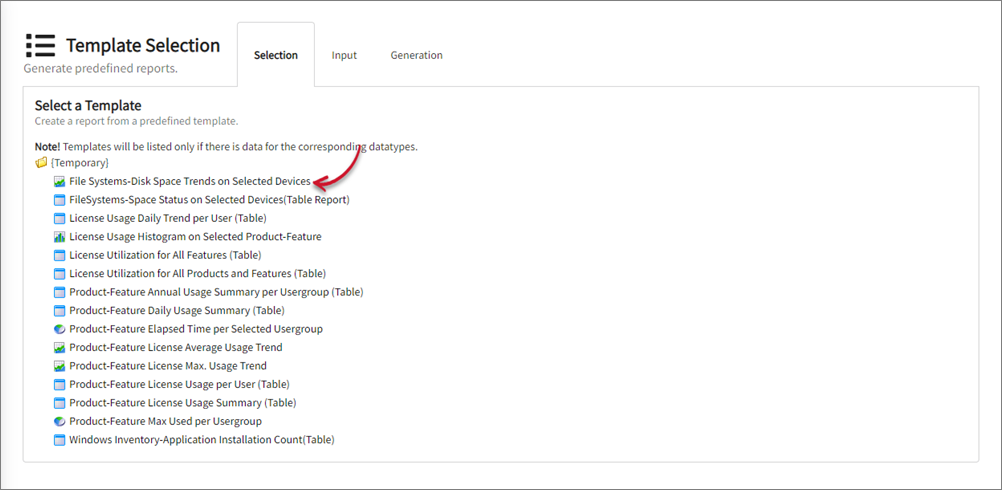
Selection Tab
This tab presents the list of predefined template reports based on the available data types in the Open iT database. An icon beside the title denotes the presentation of the reports, either tabular or graphical.
Not all data types have predefined template reports.
To check the available template reports, go to the simpleReports directory. In Windows Core Server, this is by default in C:\ProgramData\OpeniT\Data\openit_html_data\simpleReports. In Unix Core Server, for example, if the declared data directory upon installation is /data, the simple reports will be in /data/openit_html_data/simpleReports.
Click on the folder to hide or show the reports.
Available reports per data type:
| Data Type | Title | Filename |
|---|---|---|
| 0 | Pacct-CPU Usage-Monthly Trend for Selected GIDs | pacct-cpu-usage-monthly-trend-for-selected-gids.rep |
| 0 | Pacct-CPU Usage-Top 20 Hosts | pacct-cpu-usage-top-20-hosts.rep |
| 0 | Pacct-CPU Usage-Top 50 Commands on Hosts | pacct-cpu-usage-top-50-commands-on-hosts.rep |
| 0 | Pacct-CPU Usage Trend-on Selected Hosts | pacct-cpu-usage-trend-on-selected-hosts.rep |
| 0 | Pacct-CPU.IO.ET for Commands Run Over 1000 Times(Table Report) | pacct-cpu.io.et-for-commands-run-over-1000-times(table-report).rep |
| 0 | Pacct-Elapsed time(> 25 hours) for Commands(Table Report) | pacct-elapsed-time(%3E-25-hours)-for-commands(table-report).rep |
| 6 | SAR-Swap Out Blocks(> 10) Trends on Selected Hosts | sar-swap-out-blocks(%3E-10)-trends-on-selected-hosts.rep |
| 6 | SAR-Total CPU Time(%) Trends on Hosts | sar-total-cpu-time(%)-trends-on-hosts.rep |
| 6 | SAR-Total CPU Time(> 10%) Trends on Selected Hosts | sar-total-cpu-time(%3E-10%)-trends-on-selected-hosts.rep |
| 6 | SAR-Wait IO(> 10%) Trends on Selected Hosts | sar-wait-io(%3E-10%)-trends-on-selected-hosts.rep |
| 24 | File Systems-Disk Space Trends on Selected Devices | file-systems-disk-space-trends-on-selected-devices.rep |
| 24 | FileSystems-Space Status on Selected Devices(Table Report) | filesystems-space-status-on-selected-devices(table-report).rep |
| 29 | File Space-30 Biggest(File Types) Space Consumers | file-space-30-biggest(file-types)-space-consumers.rep |
| 29 | File space-File Count and LSize for each File Temperature(Table) | file-space-file-count-and-lsize-for-each-file-temperature(table).rep |
| 29 | File space-File Count and Sizes on Selected Hosts(Table Report) | file-space-file-count-and-sizes-on-selected-hosts(table-report).rep |
| 29 | File space-Number of Files(of Each Type) on Selected Filesystems | file-space-number-of-files(of-each-type)-on-selected-filesystems.rep |
| 29 | File Space-Number of Files of each Temperature for each Type | file-space-number-of-files-of-each-temperature-for-each-type.rep |
| 29 | File Space-Number of files of various Temperature(Read) Levels for each Type | file-space-number-of-files-of-various-temperature(read)-levels-for-each-type.rep |
| 29 | File Space-Space Usage(LSize) for each User on Various Temperature Levels | file-space-space-usage(lsize)-for-each-user-on-various-temperature-levels.rep |
| 29 | File Space-Trends in Number of Files for each File Type | file-space-trends-in-number-of-files-for-each-file-type.rep |
| 29 | File Space-Trends in Space Usage(LSize) for Top 20 Users | file-space-trends-in-space-usage(lsize)-for-top-20-users.rep |
| 31 | Windows App.Usage(Elapsed Time)-(Table) | windows-app.usage(elapsed-time)-(table).rep |
| 31 | Windows App.Usage(Elapsed Time) on all Hosts | windows-app.usage(elapsed-time)-on-all-hosts.rep |
| 31 | Windows App.Usage(on Hosts) for selected Applications-(Table) | windows-app.usage(on-hosts)-for-selected-applications-(table).rep |
| 31 | Windows App.Usage(on Users) on Selected Applications-(Table) | windows-app.usage(on-users)-on-selected-applications-(table).rep |
| 33 | Windows Inventory-Application Installation Count(Table) | windows-inventory-application-installation-count(table).rep |
| 34 | Windows Application Concurrent usage histogram | windows-application-concurrent-usage-histogram.rep |
| 36 | WIN-Physical Read Rate Trends on Hosts | win-physical-read-rate-trends-on-hosts.rep |
| 36 | Windows-Processor Time(> 10%) Trends on Selected Hosts | windows-processor-time(%3E-10%)-trends-on-selected-hosts.rep |
| 45 | License-Feature Usage Histogram on Selected Vendor License-Feature | license-feature-usage-histogram-on-selected-vendor-license-feature.rep |
| 45 | License-Flex Daily Max. License Usage for Selected vendor-license-Feature | license-flex-daily-max.-license-usage-for-selected-vendor-license-feature.rep |
| 45 | License-Max and Avg Usage for all Features(Table) | license-max-and-avg-usage-for-all-features(table).rep |
| 45 | License-Max. Available and Use Overview for All vendor-licenses-Features(Table) | license-max.-available-and-use-overview-for-all-vendor-licenses-features(table).rep |
| 45 | License-Trends in Average Usage for selected Vendor License-Feature | license-trends-in-average-usage-for-selected-vendor-license-feature.rep |
| 45 | License-Trends in Max. Usage for Selected Vendor License-Feature | license-trends-in-max.-usage-for-selected-vendor-license-feature.rep |
| 45 | License- Usage(Max-Min-Avg) Status for Selected Vendor License-Feature(Table) | license-usage(max-min-avg)-status-for-selected-vendor-license-feature(table).rep |
| 46 | License-Max. Concurrent Feature Usage(Table) | license-max.-concurrent-feature-usage(table).rep |
| 46 | License-Max. Concurrent Feature Usage Trends(Table) | license-max.-concurrent-feature-usage-trends(table).rep |
| 46 | License-Max. Usage and Active Time for each Selected Feature-User(Table) | license-max.-usage-and-active-time-for-each-selected-feature-user(table).rep |
| 94 | License Usage Daily Trend per User (Table) | license-usage-daily-trend-per-user-(table).rep |
| 102 | License Usage Histogram on Selected Vendor License-Feature | license-usage-histogram-on-selected-vendor-license-feature.rep |
| 102 | License Utilization for All Features (Table) | license-utilization-for-all-features-(table).rep |
| 102 | Vendor License-Feature License Max. Usage Trend | vendor-license-feature-license-max.-usage-trend.rep |
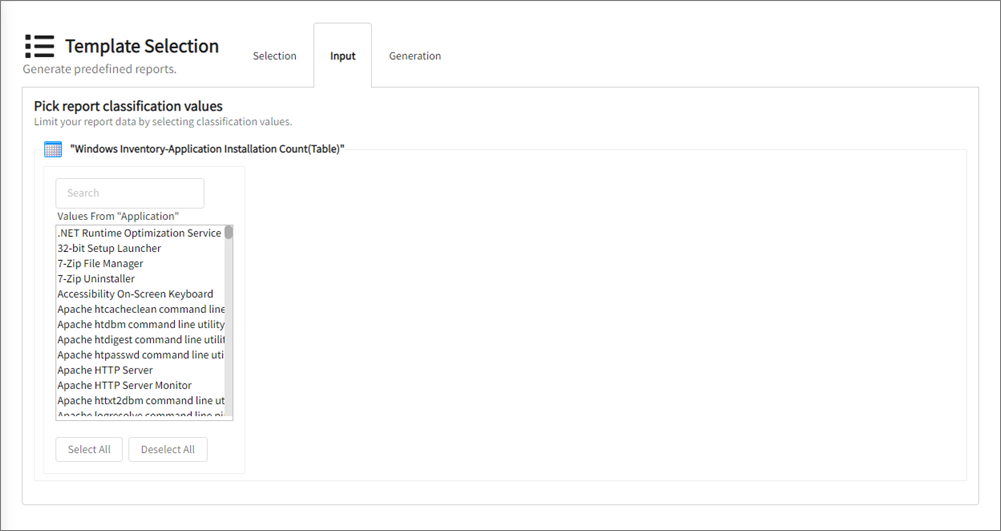
Input Tab
This tab allows the users to select the values included in the report. It shows different input lists based on the template for a particular data type. Some reports do not require value selection, while others require selecting at least one or more values.
A search bar is available to find the desired value(s) quickly, and Select All and Deselect All options are also available for easy report creation.
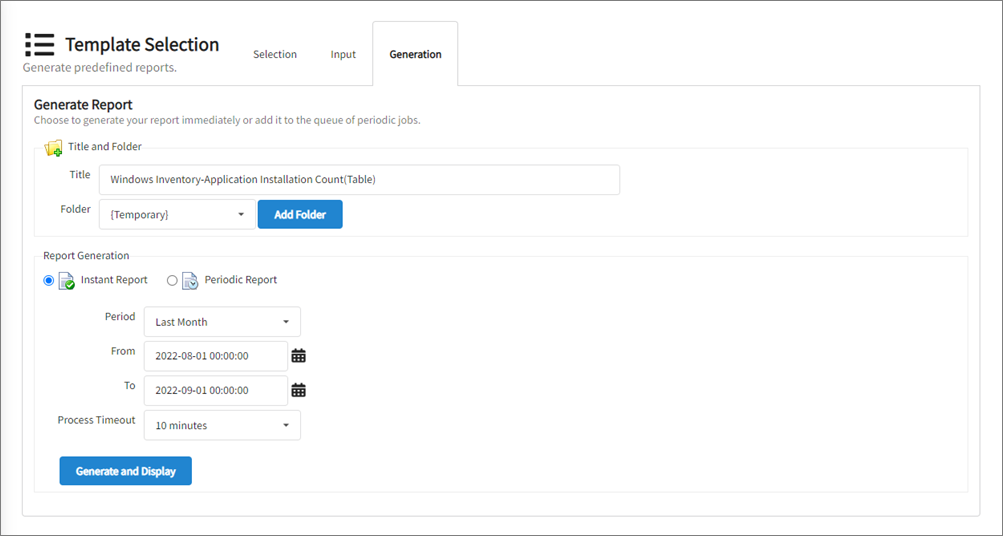
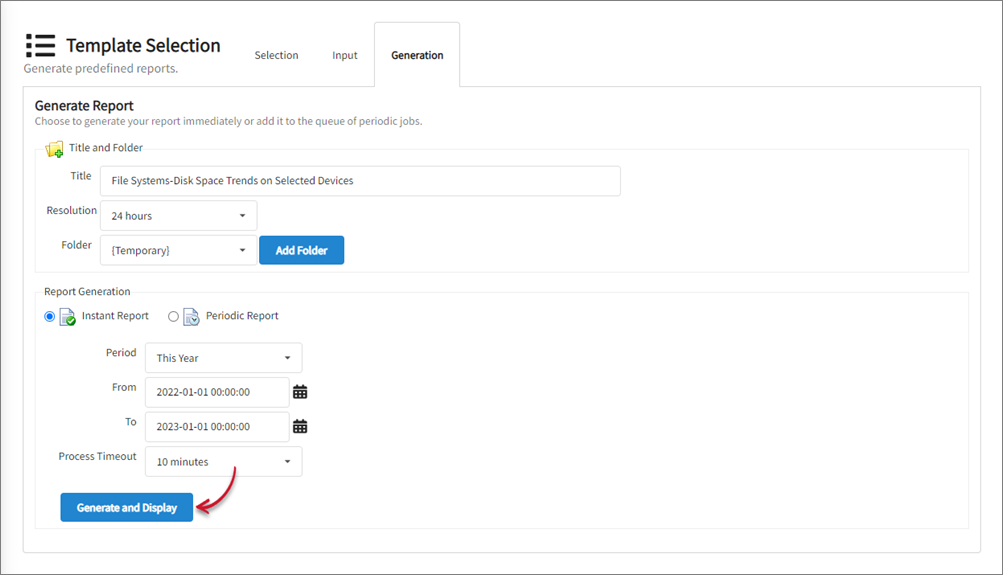
Generation Tab
This tab allows the generation of instant reports or schedule automatic generation of periodic reports.
- Title and Folder - set a title for the report and select the folder where to save the report
- Report Generation - specify whether the report will be periodic or instant, set the report period and the process timeout, and trigger the report generation
Generating Reports using the Template Selection Tab
-
Click the report to generate.
 Select Report
 -
Select the values for the report. Some template reports require value(s); others don't. Some reports automatically proceed to the Generation tab.
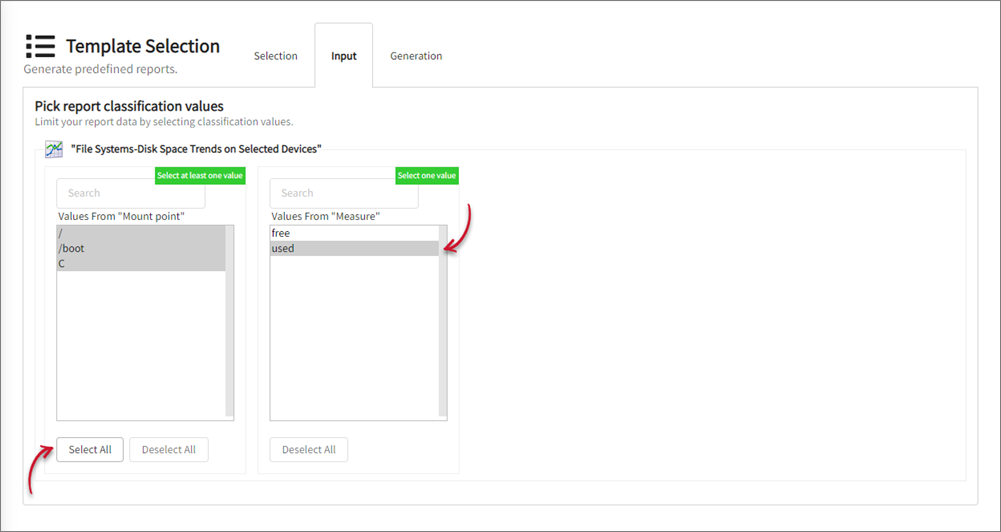 Select Values
 -
Proceed to the Generation tab.
NOTESome of the reports have Time classification; whenever this is included, there is an additional field called Resolution. There is also a suggested default value provided depending on the report, but you can opt to choose a preferred value to be used in this field. It can have values of
5 minutes,15 minutes,1 hour,24 hours,1 week,1 month, and1 year. You may refer to this link for data resolution guidelines. -
Choose where to save the report among the available folders or add a new folder by following these steps:
a. Click Add Folder; a text box will appear.
b. Type in the name of the folder.
c. Click Create. A prompt will appear to confirm the creation of the folder. -
Select the report generation frequency:
- Instant Report - generate the report immediately
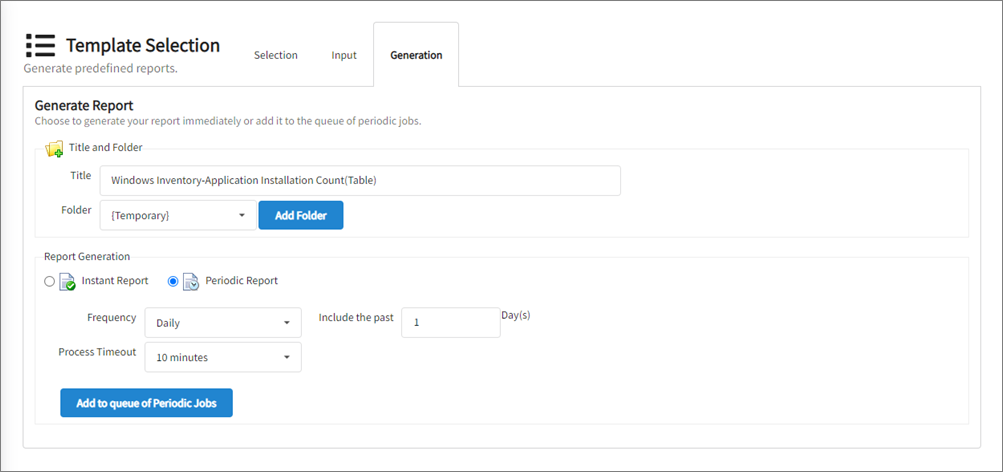
- Periodic Report - schedule the report generation
-
If an instant report is selected, provide the date ranges to include in the report by following these instructions:
a. Choose among the available periods. The From and To options are automatically updated based on the period selection.
b. If Custom is selected, provide a valid date range. Use the date picker to select dates easily.NOTETake a look at the status lines at the bottom of the web interface that display various process information, including periods of data availability.
-
If the periodic report is selected, provide the schedule of the report generation by following these instructions:
a. Choose among the available frequencies.
b. Provide the number of the chosen frequency to include in the Include the past option. -
Choose the maximum waiting time for the report generation process by selecting from the available Process Timeout values.
NOTEThe duration of the generation depends on the size of the report. The user can choose a longer process timeout value or limit the data size of the report if an error occurs.
-
Click Generate and Display or Add to Queue of Periodic Jobs.
 Generate Instant ReportNOTE
Old generated reports in version 9.16 to 9.18 may display formatting issues in version 9.19 due to style changes. To fix this issue, users should revisit the reports by accessing either through the Generated Reports Tab or the Home Page.