Consumption-Based Licensing Portlets
Portlets are panels included in a dashboard. It contains specific data that portrays essential information.
Use these descriptions and specific configurations to manipulate the display of the individual portlet.
Daily Consumption Trend
A line graph showing the daily trend of license consumption for the selected Vendor and Agreement. This includes applications configured with Distinct User per day (DU-1D) and Distinct Host per day (DH-1D) license metrics.
Chart Functionalities
Click the Zoom item to aggregate the display based on the selection. Monthly is selected by default.
- W - Weekly
- M - Monthly
- Q - Quarterly
- Y - Yearly
Use the slider to zoom in or out to a specific chunk of time.
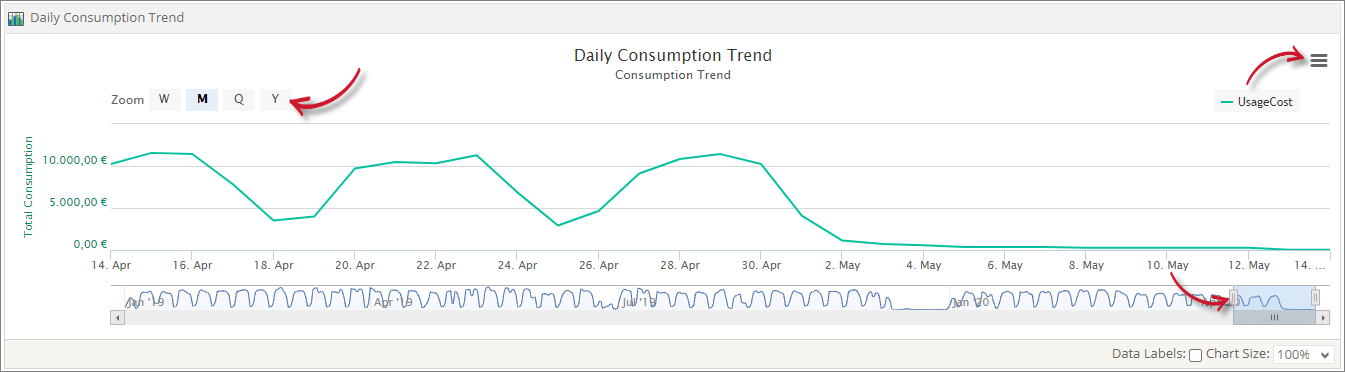
Click the Print and Export button located at the upper-right corner of the portlet to export the current data displayed.
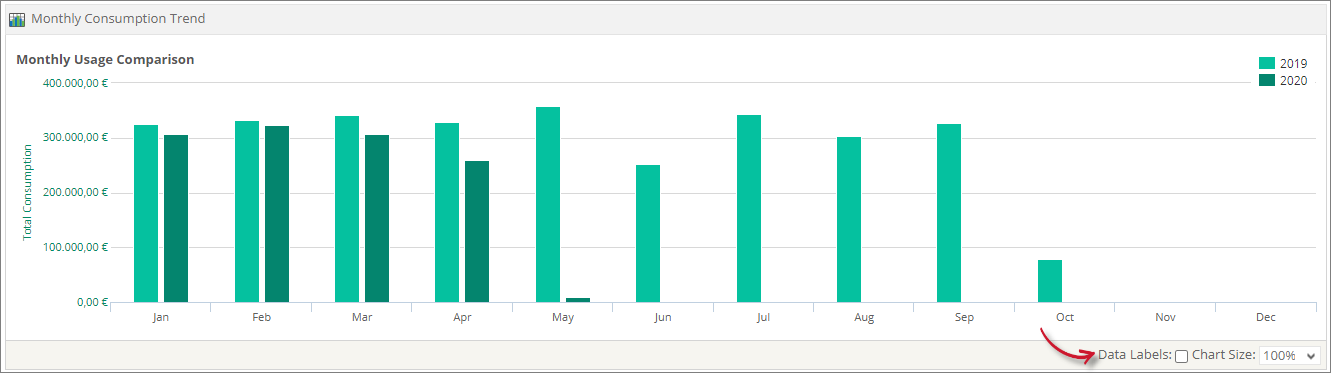
Monthly Consumption Trend
A column graph showing the monthly comparison of selected selected Vendor and Agreement's total yearly consumption. This includes an application configured with Distinct User per day (DU-1D), Distinct Host per day (DH-1D), Distinct User per month (DU-1M), and Distinct Host per month (DH-1M).
Chart Functionalities
Use the following chart settings to manipulate how the chart is displayed.
- Data Labels - shows the data labels in the chart.
- Chart Size - choose among the available chart size options to resize the chart. The default is 100%.
Current Consumption
A chart showing the difference between the total consumption and the total allotment of the selected Vendor and Agreement. This also shows the number of distinct users and hosts that use the applications configured with license cost.
Chart Functionalities
Use the following chart settings to manipulate how the chart is displayed.
- Data Labels - shows the data labels in the chart.
- Chart Size - choose among the available chart size options to resize the chart. The default is 100%.
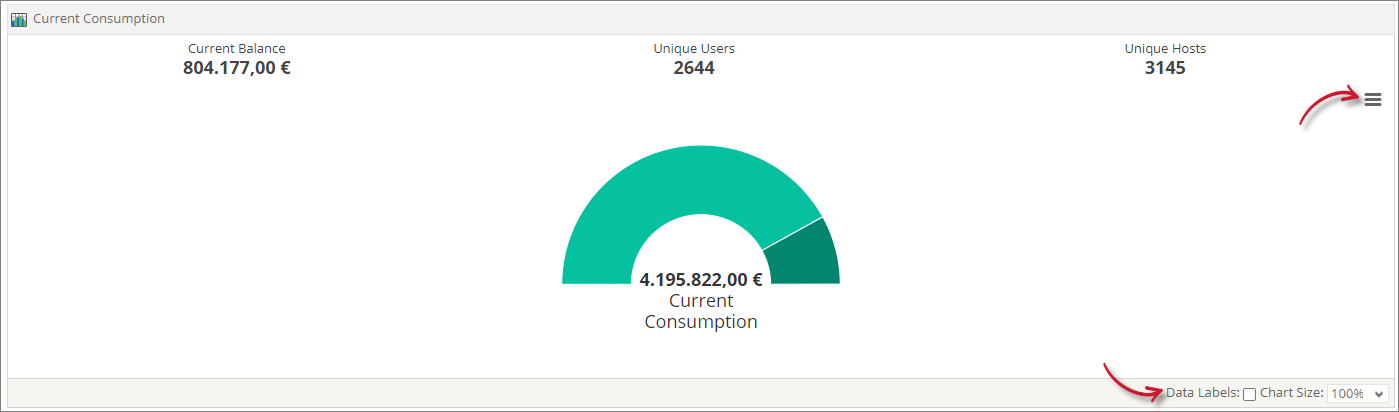
Click the Print and Export button located at the upper-right corner of the portlet to export the current data.
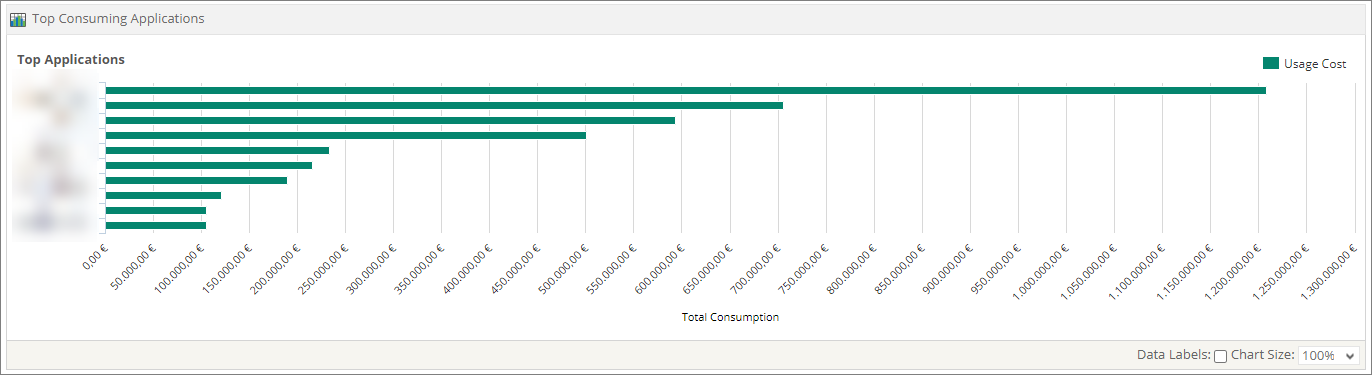
Top Consuming Applications
A bar graph showing the Top 10 applications that consume the most license cost.
Chart Functionalities
Use the following chart settings to manipulate how the chart is displayed.
- Data Labels - shows the data labels in the chart.
- Chart Size - choose among the available chart size options to resize the chart. The default is 100%.
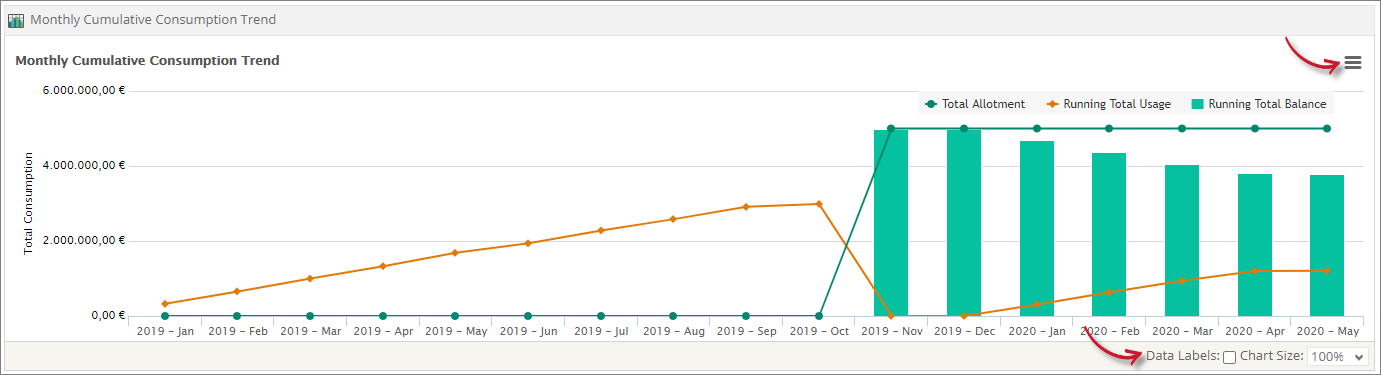
Monthly Cumulative Consumption Trend
A combo chart showing a column graph of the monthly comparison of the total current balance on a cumulative basis.
This also includes a line graph showing the total allotment and the running total usage. This includes an application configured with Distinct User per day (DU-1D), Distinct Host per day (DH-1D), Distinct User per month (DU-1M), and Distinct Host per month (DH-1M).
Chart Functionalities
Use the following chart settings to manipulate how the chart is displayed.
- Data Labels - shows the data labels in the chart.
- Chart Size - choose among the available chart size options to resize the chart. The default is 100%.
Click the Print and Export button located at the upper-right corner of the portlet to export the current data.