Table View
This contains the interactive table for creating ad hoc reports.
Interactive Table
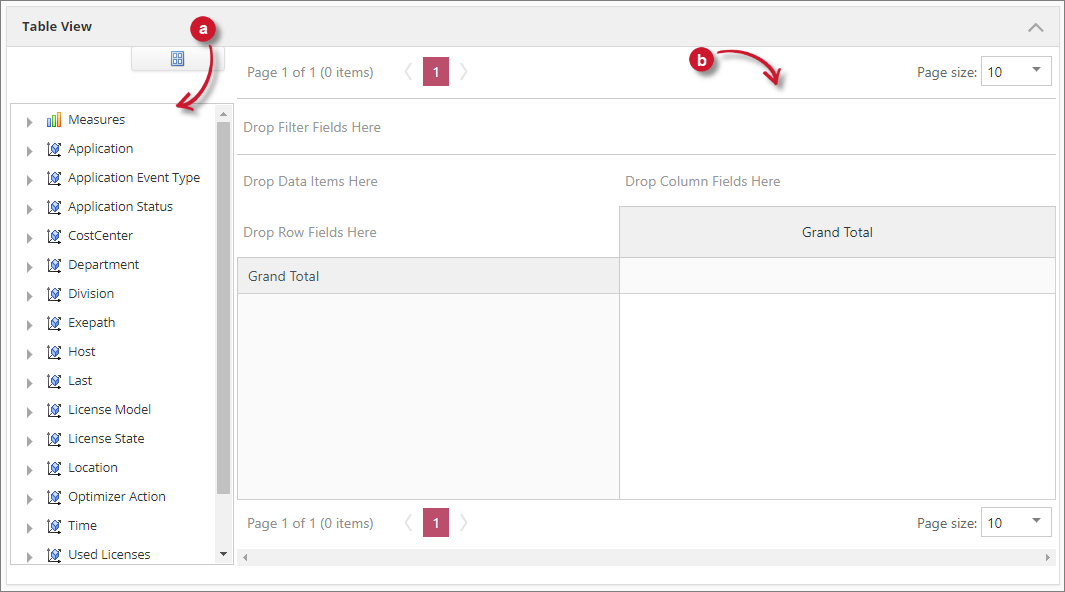
The interactive table gives the capabilities to the user to create ad hoc reports from the processed data. It has two main elements:
a. Field List - this contains Measures "Totals" and Classifications.
b. Drop Area - an interactive area where users can drag and drop elements from the Field List to build a report.
Field List
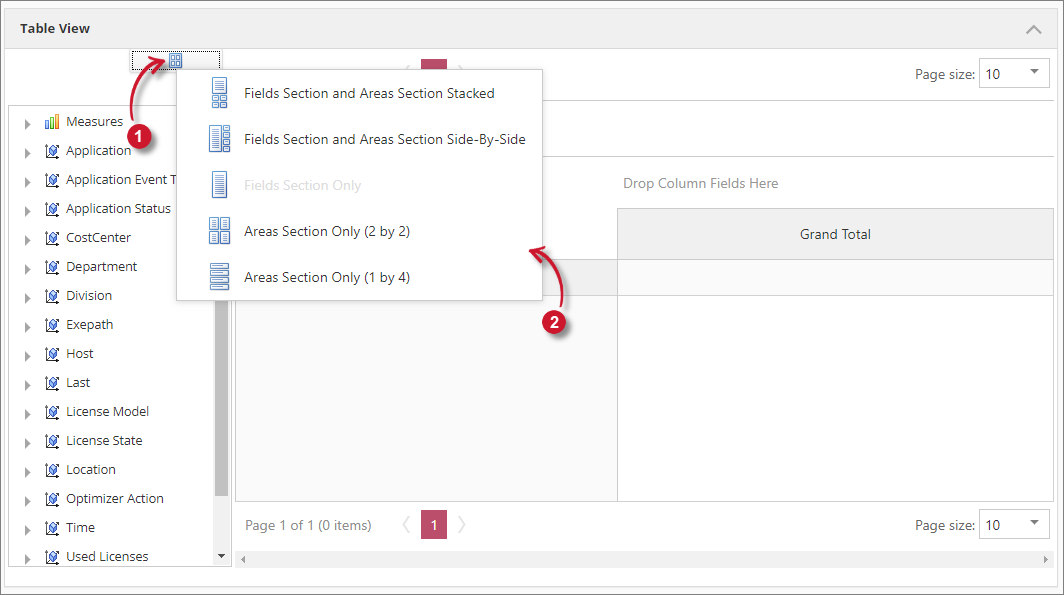
The Field List contains all the information that can be reported in the interactive table. It has helpful layouts for certain situations.
Follow these instructions to switch to various layouts:
-
Click the Layout symbol above the Field List.
-
Choose among the available layouts as desired.
- Fields Section and Areas Section Stacked
- Field Section and Areas Section Side-By-Side
- Field Section Only (selected by default)
- Areas Section Only (2 by 2)
- Areas Section Only (1 by 4)
 Interactive Table Field List
It should automatically apply the chosen layout in the Field List.
Drop Area
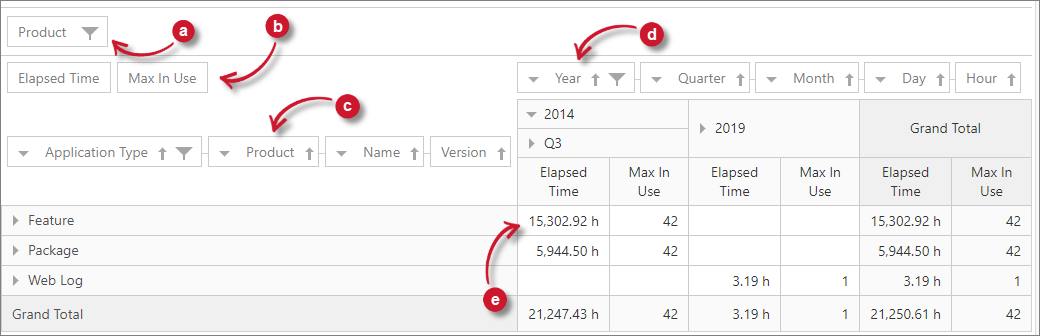
The Drop Area serves as the reporting pane. It contains various sections that accept specific elements from the Field List.
The following are the sections of the Drop Area:
a. Filter Section - accepts classifications for global filtering.
b. Data Item Section - accepts totals or measures.
c. Data Row section - accepts classifications for value segregation.
d. Column Field Section - accepts classifications for value segregation.
e. Value Section - displays the values of the measures in the Data Item Section.
Reporting Basics
The reports contain measurements and classifications. Measurements are the numerical values while Classifications are the data categories. All the data in the reporting table is also in the Chart View. Every time an element is dragged in the reporting table, a chart element is also being added in the chart view. By default, the chart type is Line Chart.
Adding Elements
Follow these instructions to add one or more Measurements ("Totals") and Classifications to the table Drop Area.
-
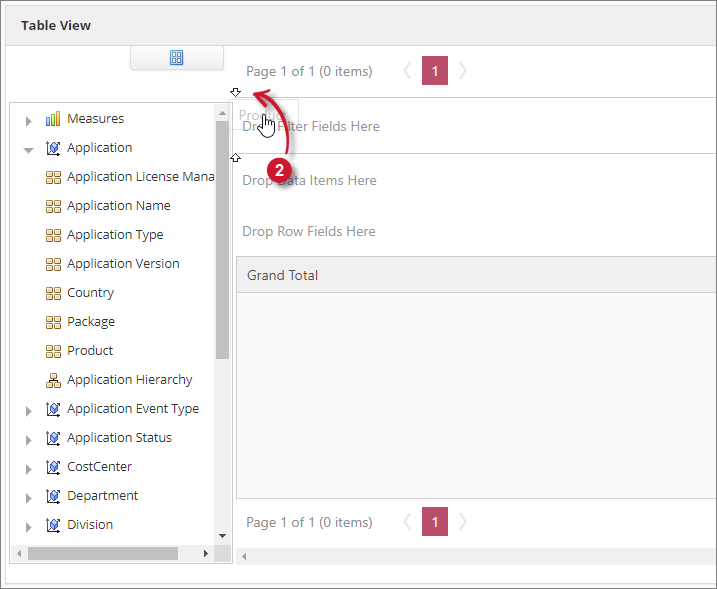
Select an element from the Field List and either drag it to the table Drop Area or in one of the options of the Area Section.
-
When the user drags an element into a field, the field will have two arrows pointing inward the field. This indicates that it accepts the element.
 Interactive Table Add Elements
 -
To move an element, simply drag and drop it onto its new place.
Removing Elements
Follow these instructions to remove one or more Measurements (Totals) and Classifications in the table Drop Area:
-
Drag the element from the Drop Area to the Field List.
-
When the user drags an element back into the field list, an X mark should appear beside the field. This indicates that it will remove the element.
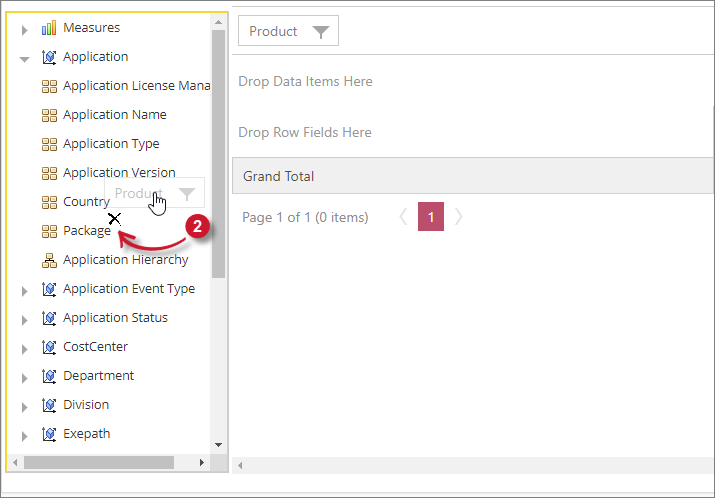 Interactive Table Remove Elements
 -
Drop the element in the Field List and it should be removed from the data area.
Measurements
Measurements are the items under Measures in the Field List. These can only be placed in the Data Items Area. When a measure is placed, the value should appear in the totals area of the table.
Follow these instructions to add measures in the report:
-
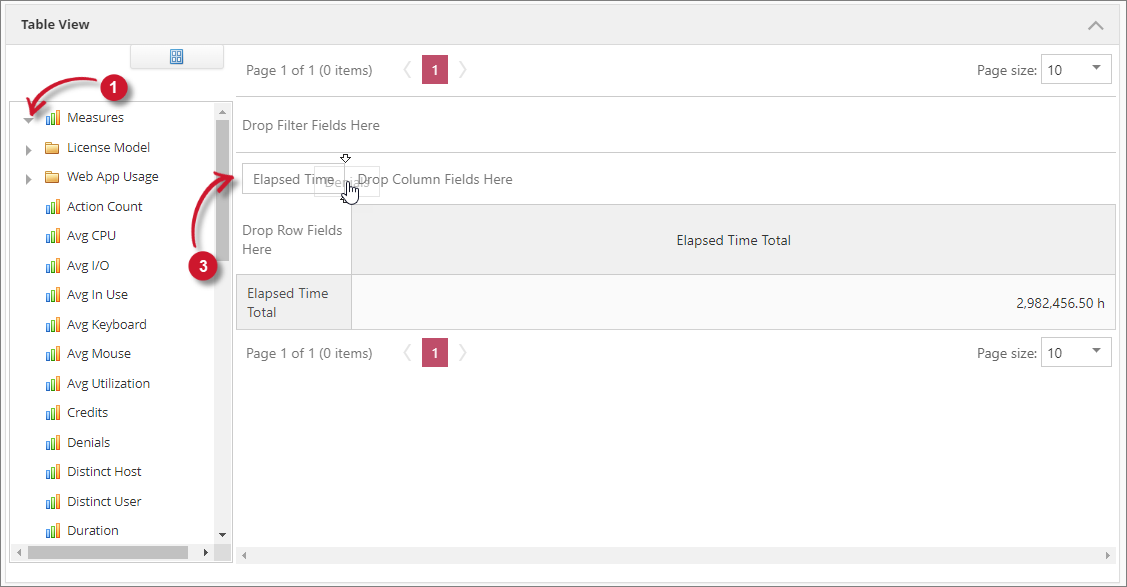
In the Field List, expand the Measures node. All the measures should be displayed.
-
Choose among the available measures.
-
Drag and drop the selected measure in the Data Items Area.
 Measurements
To add another measure, simply place it beside the currently reported measure.
Application Cube Measures
This is the list and description of all the available measures that can be reported in the Applications cube.
| Measure | Description |
|---|---|
| Active Time | Under the License Model folder. This shows the number of minutes the license is in active state. |
| Web Data Stream | Under the Web App Usage folder. This shows the packets streamed in kilobytes (KB). |
| Web Keyboard Press | Under the Web App Usage folder. This shows the count of keyboard presses. |
| Web Mouse Clicks | Under the Web App Usage folder. This shows the count of mouse clicks. |
| Web Mouse Movement | Under the Web App Usage folder. This shows the count of browser events when moving the mouse. |
| Web Scroll | Under the Web App Usage folder. The number of browser events when scrolling. |
| Web Visit Count | Under the Web App Usage folder. This shows the total number of visits to a web application. |
| Web Visit Duration | Under the Web App Usage folder. This shows the total number of time spent staying on a web application. |
| Action Count | Specifies the count of a recorded LicenseOptimizer action. |
| Avg CPU | Specifies the amount of CPU time spent by process within the report interval. It is measured in Percentage. |
| Avg I/O | Measures the amount if input/output characters used by processes during the report interval computed by the number of characters. This is always set to zero (0). |
| Avg in Use | Indicates the average number of used licenses. |
| Avg Keyboard | Specifies the average number of keyboard strokes, measured per second. A keyboard event is a key pressed. For these events, they are either the symbol of the key or the name of the key if symbol cannot be expressed. A switch is a switchover between keyboard and mouse without a break. This number indicates how much the keyboard and mouse are used together. This measurement shows the keyboard and mouse events information when using an application. Since a user interacts with the application by using any or both of these hardware components, it is good to know the event patterns corresponding to these components when a particular application is used. It is also good to know how intensely a particular key, mouse button or combinations of these have been used. |
| Avg Mouse | Indicates how many times a particular keyboard key, or a mouse button or wheel has been used either individually or in combination with each other, by a particular user on a host for a particular application. The average number of mouse events is measured per second. The Avg Mouse is reported as time-period lengths and totals. This could be defined as a period of mouse and/or keyboard events where the gap in time between each event is less than a configured value. The default is five (5) seconds. |
| Avg Utilization | Contains the percentage equivalent of the average usage of license ("Avg In Use"). |
| Credits | This is the computation of session hours multiplied to the cost of a feature. |
| Denials | Specifies the count of how many times a user had been denied to get a license from a license server. |
| Distinct User | Identifies the number of unique users selected from the database. |
| Distinct Host | Identifies the number of unique hosts selected from the database. |
| Duration | Measures how long a user had an application in use, regardless of how many licenses were being used. Running time is the collected time interval data for this feature or feature version. It is measured in Hours. |
| Elapsed Time | Shows the sum of the times, in hours, that each individual license is checked out. If a user has a license checked out from 1pm to 2pm, this is counted as one hour. If a user has 10 licenses checked out from 1pm to 2pm, the Elapsed time would be counted as 10 hours (1 hour per license). |
| Events | Reports on the total number of events based on the license manager's debug logs. Select Application Event Type from the Classifications value to filter available events which are: in, out, denied, supported, removed, queued, and dequeued. |
| Max Available | Indicates the maximum number of licenses available for use. The calculation of this data is done once for a whole day during the processing of raw license data. When a license file is updated during the day, the maximum will not reflect this update until the processing of data on the following day. This may cause the measurement's Avg Utilization, Min Utilization and Max Utilization to have values too large or small since these are calculated using the Max Available licenses classification value. |
| Max In Use | Represents maximum number of used licenses. It can be the maximum number of concurrent licenses used by a user, usergroup, or hostgroup of the selected feature with the maximum number of executable concurrent user on host. |
| Max Utilization | Indicates the maximum utilization of licenses, or Max in Use. Measured in Percent and computed as (Max in Use / Max Available) * 100 (e.g. 5/10 = 0.5 * 100 = 50%). |
| Min In Use | Indicates the minimum Number of used licenses. |
| Min Utilization | Indicates the minimum utilization of licenses, or Min in Use. Measured in Percent and computed as (Min in Use / Max Available) * 100 (e.g. 1/10 = 0.1 * 100 = 10%). |
| SMS Distinct User | Indicates the number of unique user for System Center Configuration Manager (SCCM) or System Management Server (SMS) data. |
| SMS Max Concurrent Users | Indicates the number of maximum concurrent users for System Center Configuration Manager (SCCM) or System Management Server (SMS) data. |
| Used Token | This shows the number of tokens used. Started support in v10.2. |
| User Days | This shows the number of distinct users per day. If reported on lower resolutions (i.e monthly) SUM is used as an aggregation. |
| User Session Hours | This shows the count (hours) with usage per day. |
Storage Cube Measures
This is the list and description of all the available measures that can be reported in the Storage cube.
| Measure | Description |
|---|---|
| Avg Disc Space | The average size of the file system over time, that may be Free, Used or Total. This measure requires the Measure classification for accurate report. |
| Avg Files Count | The average number of files accounted over time. |
| Avg Logical Size | The average total size over time of all the selected classification's files. |
| Avg Physical Size | The average total block size of all the selected classification's files. |
Classifications
The Classifications allow the user to specify how a user wanted to see the data. Expand the desired dimension to see the list of classifications under it. Furthermore, classifications can be added in the reporting table in three different ways: Row Items, Column Items, and Filter Items.
It is important that a measure or measures are in place when using classifications to successfully display the values of the selected classification.
Classifications as Row Item
Follow these instructions to add classifications as a row item:
-
Drag the classification from the Field List.
-
Drop the classification in the row items area designated in the reporting table.
-
List values vertically together with the measures values in the reporting table.
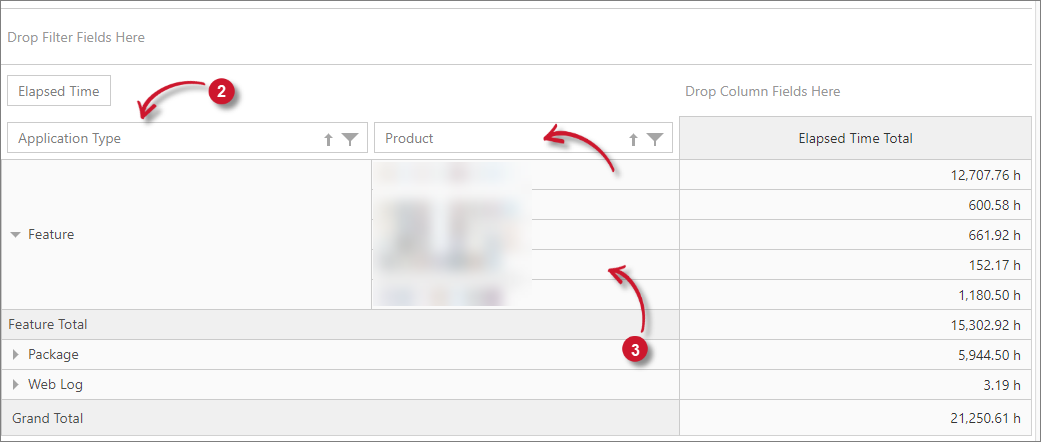
It is also possible to add multiple classifications in the reporting table as row items. Simply drag and drop the desired classification beside the classification already in the reporting table. The classifications will then be in hierarchy having expand/collapse symbol for an organized reporting. Simply click this icon to see values of the classification added.
Classifications as Column Item
Follow these instructions to add classifications as a column item:
-
Drag the classification from the Field List.
-
Drop the classification in the column items area designated in the reporting table.
-
List values horizontally as column headers in the reporting table.
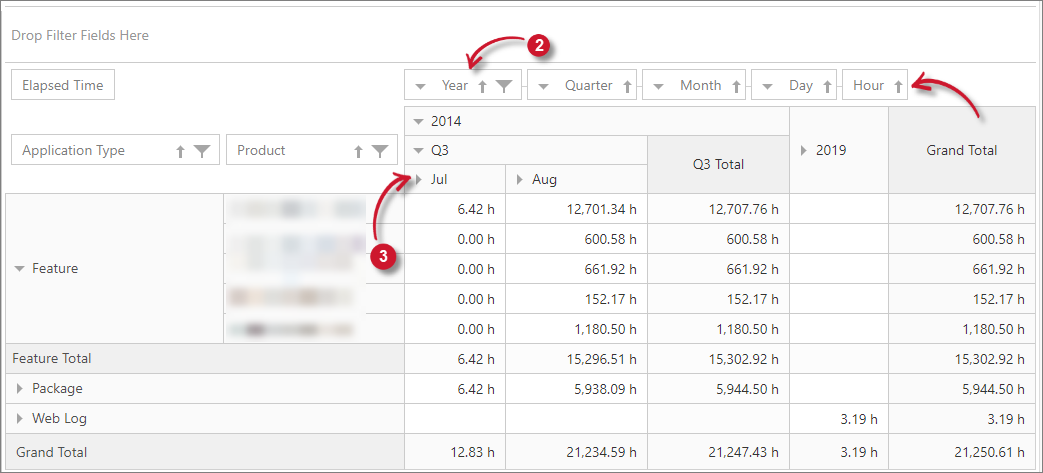 Interactive Table Classifications Column Item
It is also possible to add multiple classifications in the reporting table as column items. Simply drag and drop the desired classification beside the classification already in the reporting table. The classifications will then be in hierarchy having expand/collapse symbol for an organized reporting. Simply click this symbol to see values of the classification added.
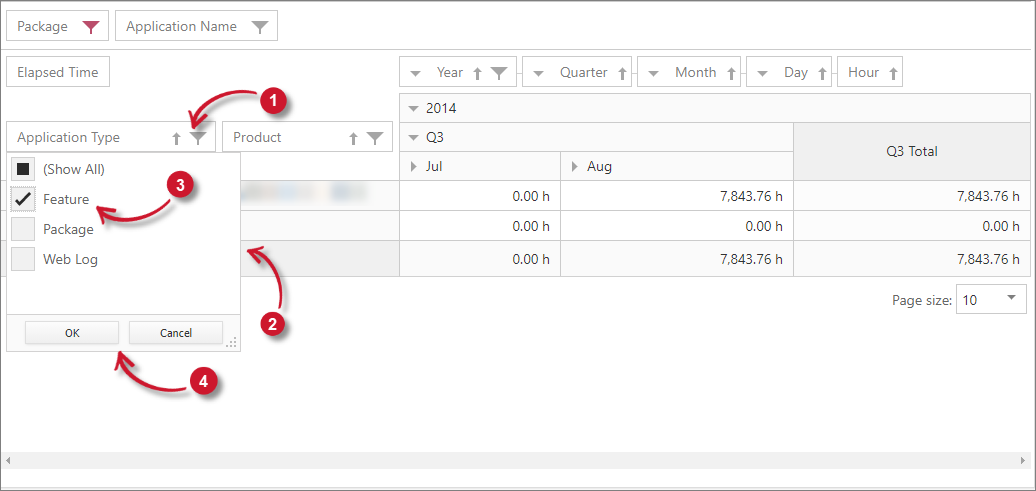
Classifications as Filter Item
Follow these instructions to add classifications as a filter item to filter what is already in the reporting table.
-
Drag the classification from the Field List.
-
Drop the classification in the Filter Items Area designated in the reporting table.
-
Click the Filter symbol in the right side of the classification. All values are selected by default.
-
Select a specific value under the selected classification.
-
Click OK and this should filter the classifications in the reporting table.
 Interactive Table Classifications Filter Item
NOTEAdding multiple classifications as the filter is the same as adding multiple items in rows and columns.
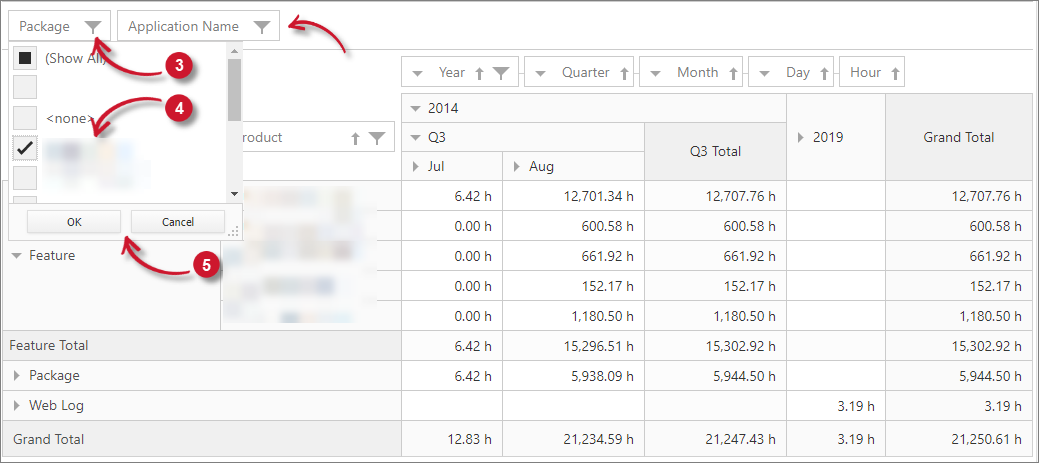
Filtering Classifications
Adding classifications as filter items is considered global filtering. It affects all the classifications in the reporting table. However, it is also possible to filter the classifications solely if it is necessary to filter specific classifications further to get the needed report.
In order to do this:
-
Click the filter symbol in the right side of the corresponding classification.
-
List of values under the classification will appear. Uncheck all values by unchecking Show All option.
-
Choose desired values among the list.
-
Click OK to apply the changes.
 Interactive Table Filtering Classifications
This should filter the classification values in the reporting table.
This filtering can be done on each of the classification in the reporting table.
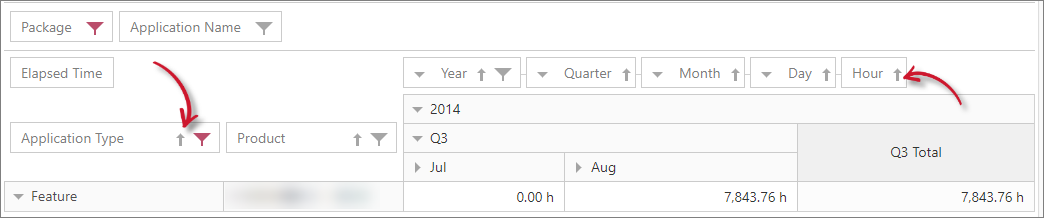
Sorting Classifications
Values in a classification are sorted in ascending alphabetically. Click the sorting symbol to invert the order.
Applications Cube Classifications
This is the list of all the available classifications and its descriptions in Applications cube.
Application Dimension
This dimension contains information of applications available in the data.
| Attribute Name | Description |
|---|---|
| Application Hierarchy | Provides an overview of the vendor licenses or applications that were used. Drill down this classification to a more specific data: - ApplicationType - name of the grouping in which data types are classified, such as Feature, Handle, and Package. - Vendor License - name of the vendor license in each specific type of feature. - Name - name of the application for each vendor license categorized into Feature, Handle, and Package. - Version - version of the selected feature or vendor license categorized into Feature, Handle, and Package. |
| Application License Manager | Shows a list of license servers handling all vendor licenses supported by the Open iT software. To name a few, FlexNet, IBM LUM, Sentinel, etc. |
| Application Name | Contains the name of each application or program for a specific vendor license associated with Executable. It is the same table list seen in the Application Hierarchy > Name, only arranged alphabetically (not by vendor license). |
| Application Type | Contains the same listing found in the Application Hierarchy > Application Type that shows the name of grouping from which data are classified. |
| Application Version | Contains the same listing found in the Application Hierarchy > Version. When categorizing application version, use this classification. |
| Country | Shows a list of countries. |
| Package | Shows a list of package that a specific feature belongs. |
| Vendor License | Indicates the name of a specific application in a vendor license, which is the same table list seen in the Application Hierarchy > Vendor License, only arranged alphabetically (not by application name). |
Application Event Type Dimension
This dimension contains information of various license events.
| Attribute | Description |
|---|---|
| Application Event Type | Identifies and filters Events measurement into denied, dequeued, in, out, queued, removed, and unsupported. |
| Denial Reason | Identifies the reasons for license denial. |
| Forward Vendor License | Identifies the license server which the user got a license after denials from previous attempts of checking out license. |
Application Status Dimension
This dimension contains details about the various application activity status.
| Attribute | Description |
|---|---|
| Application Status | Indicates the status of Executable files. The Executable is the name of the binary for an application. The name of the executable is often hidden from the user and there is often a direct correlation between their names. For example, Winword.exe is Microsoft Word for Windows. The values for this classification can be Active, Corrupted, Disabled, Inactive, Logged, Missing Usage Data, On IRQ, Running, Suspended, Terminated, and Uninstalled (including unknown). |
Exepath Dimension
This dimension contains details about the specific path of the recorded executable.
| Attribute | Description |
|---|---|
| Executable Path | Contains the full system path of the binary or the executable of a certain application. Members with NULL values are converted to Unknown. |
Host Dimension
This dimension contains computer or machine information hosting the license.
| Attribute | Description |
|---|---|
| Host Hierarchy | Shows an overview of the machine, and the domain to which machine belongs, in which the application is being used or running. Drill down this classification for more specific information: - Host Domain - the domain the host machine belongs. - Host Name - the host machine name. |
| Host Domain | Contains the name of the domain to which the monitored host machine belongs. It is the same list seen in the Host Hierarchy > Domain. |
| Host Name | Contains the name of the monitored host machine. It is the same list seen in the Host Hierarchy > Host. |
Host Group Dimension
This dimension contains the host group information.
| Attribute | Description |
|---|---|
| Host Group | Contains the name of the monitored host group where the host belongs. |
Last Dimension
This dimension includes filter values for time classification.
| Attribute | Description |
|---|---|
| Last | Used for filtering values for browsing certain number of days or weeks (e.g., Last Day, Last 7 Days, Last 365 Days, etc.). |
License Model
This dimension includes details about various licensing scheme.
| Attribute | Description |
|---|---|
| Licensing Model | Contains various categories of licensing models for DSLS License Manager. The possible values are Online or Concurrent, NamedUser, and Token. |
| Licensing Model Assignment | Indicates the status of the license if assigned or unassigned. |
| Licensing Model Status | Indicates the activity status of the license. The possible values are Active, Inactive, and undef. |
License State Dimension
This dimension includes information about the various license statuses.
| Attribute | Description |
|---|---|
| License State | This is the licensing model of the Feature (e.g., online, offline or queued). Offline license are those that are borrowed(linger). |
Optimizer Action Dimension
This dimension includes information about the various actions rendered during license harvesting.
| Attribute | Description |
|---|---|
| Optimizer Action | Indicates the actions done by the LicenseOptimizer. This classification includes: Log, Suspend, and Quit. |
Used Licenses Dimension
This dimension includes filter for the number of licenses used.
| Attribute | Description |
|---|---|
| Used Licenses | Indicates the number of licenses used. |
Web Information Dimension
This dimension includes various details about the recorded web applications.
| Attribute | Description |
|---|---|
| Web Browser | Contains the list of recorded or used web browsers. |
| Web Domain | Contains the list of recorded or visited web domains. |
| Web Title | Contains the list of recorded or visited web titles. |
| Web URL | Contains the list of recorded or visited web Uniform Resource Locator (URL). |
Virtual Classifications
Virtual predefined classifications generated by the Open iT client are relatively static. It can act as a source of new virtual classification by using a mapping mechanism. The mapping has no restrictions. It only takes a source value and gives it a virtual value. Although the basic mapping is one-to-one, it is possible to map many-to-one (collapse), or one-to-many (split).
A typical scenario would be automatically importing this data from the organization's user directory. The Analysis Server supports reading this data from a pre-prepared CSV file containing a current snapshot of the user data. The data loading component OpeniT.Server.Etl.Console.exe then tracks changing properties, such as whether a user changes email address, location, or cost center. These changes will then be recorded in Analysis Server's database.
The reporting cube has predefined Classifications that are bound to the user:
Cost Center Dimension
| Attribute | Description |
|---|---|
| User Cost Center | One of the predefined or virtual classification that is an example of one-to-many mappings ("Groups"). The table list includes 50 States Codes. |
| Business Unit | A predefined or virtual classification that is an example of one-to-many mappings ("group-to-groups"). Used to categorize various cost centers into one group and calculate additive measurements (e.g., Elapsed Time and Denials). |
Department Dimension
| Attribute | Description |
|---|---|
| User Department | Also an example of one-to-many mappings, this table lists department names from which user belongs to at the time of polling. If the user-to-groups mapping is unavailable (missing file or no map for user), the value will show unknown. |
| Business Unit | A predefined or virtual classification that is an example of one-to-many mappings ("group-to-groups"). Used to categorize various departments into one group and calculate additive measurements (e.g., Elapsed Time and Denials). |
Division Dimension
| Attribute | Description |
|---|---|
| User Division | Generally classified as an area where the user belongs, such as Eastern, Northern, Southern, and Western. This is also a predefined classification and an example of one-to-many mappings. If mapping is unavailable or there is no map for that user, the value will show unknown. |
| Business Unit | A predefined or virtual classification that is an example of one-to-many mappings ("group-to-groups"). Used to categorize various divisions into one group and calculate additive measurements (e.g., Elapsed Time and Denials). |
Location Dimension
| Attribute | Description |
|---|---|
| User Location | Corresponds to the exact location or city where the user belongs. |
| Business Unit | A predefined or virtual classification that is an example of one-to-many mappings ("group-to-groups"). Used to categorize various locations into one group and calculate additive measurements (e.g., Elapsed Time and Denials). |
User Dimension
This dimension includes various information about the current user of the license or application.
| Attribute | Description |
|---|---|
| User Email | A predefined classification bound to user. An example of one-to-one mapping ("Attributes") that corresponds to the user's email address. |
| User Email Masked | Same as User Email classification, but using a masked email address. (e.g., user_lambda@example.com) |
| User Employee Type | A predefined classification bound to user. An example of one-to-one mapping ("Attributes") that identifies the type of employee, such as Contractor, Fulltime, Intern, Part Time, and Trainee. |
| User Full Name | A predefined classification value that gives the full name of the user. |
| User Id | A predefined classification value, known as UID or User Identification (owner of the file). |
| User Id Masked | Same as User Id classification, but using a masked user id (e.g., User_1). |
| User Manager | A predefined classification bound to user. It identifies the distinguished name of the user's manager. |
Time Classifications
A trend report shows usage over time. To present this in a graphical report, time classification must be included.
The time dimension includes the following classifications:
Time Buckets
| Attribute | Description |
|---|---|
| Time Day of Month | Categorized each day from 1 to 31 of the calendar month. |
| Time Day of Year | Categorized each day from 1 to 364 or 365 of the calendar year. |
| Time Hour | Categorized as 24-hour duration (0 to 23). In order to see what time of day is generally the busiest of a certain month, use the Time Hour as the bucket, and all usage will be categorized by what time of day (24-hour span) it takes place. |
| Time Iso Week | Allows the user to drill down into the time dimension on a weekly basis. The week numbering is based on ISO 8601 (usually used by European countries). |
| Time Iso Week Day | Allows the user to drill down into the time dimension on a daily basis. The week numbering is based on ISO 8601 (usually used by European countries). |
| Time Iso Week Year | Allows the user to drill down into the time dimension on a yearly basis. The week numbering is based on ISO 8601 (usually used by European countries). |
| Time Minute | Categorized each minute of an hour from 01 to 59. |
| Time Month | Categorized by calendar month (January to December). In order to know what specific month a certain application reached its maximum usage, use Time Month as the bucket. |
| Time Quarter | Categorized per quarter from 1 to 4 (Q1, Q2, Q3, and Q4). |
| Time Week | Categorized per week from 1 to 53 (W01 - W53). |
| Time Week Day | Categorized as calendar week from Sunday to Saturday. |
| Time Year | Sets a specific time-range for the report yearly such as 2009, 2010, 2011, etc. |
Time Dimension
| Attribute | Description |
|---|---|
| Epoch by Hour | The converted Time Hour to Unix time. |
| UTC Date | Indicates date in UTC +00 time zone. |
| DateTime Month Calendar | Allows the user to drill down into the time dimension on a monthly basis. It has the date format YYYY-MM-DD. It includes Year, Quarter, Month, Day, and Hour. |
| Iso Week Hierarchy | Allows the user to drill down into the time dimension on a weekly basis. The week numbering is based on ISO 8601 (usually used by European countries). |
| Month Hierarchy | Allows the user to drill down into the time dimension on a monthly basis. Expand the values to Year, Quarter, Month, Day, and Hour. |
| Week Hierarchy | Allows the user to drill down into the time dimension on a weekly basis. Expand the values to Year, Week, Day, and Hour. |
| Zone | Includes three categorized time zones, such as Europe/Oslo, US/Central and US/Pacific Time. |
Storage Cube Classifications
This is the list of all the available classifications and its descriptions in Storage cube.
Domain Host Dimension
This dimension contains computer or machine information hosting the license.
| Attribute | Description |
|---|---|
| Host | Contains the name of the monitored host machine. |
Epoch Dimension
This dimension contains classification for Unix Time.
| Attribute | Description |
|---|---|
| Hour | Contains the converted Time Hour to Unix time. |
File Status Dimension
This dimension contains the classification for file statuses.
| Attribute | Description |
|---|---|
| File Status | Contains the various categories of the status of the file. The available items are plain, compressed, and migrated. |
File System Dimension
This dimension contains the classification for file systems.
| Attribute | Description |
|---|---|
| File System | Contains the names of the file systems where the files reside. |
File Type Dimension
This dimension contains the classification for file types.
| Attribute | Description |
|---|---|
| File Type | Contains various categories that identifies the type of the file. Some of the file types are - text, library, and binary. |
Last Dimension
This dimension includes filter values for time classification.
| Attribute | Description |
|---|---|
| Last | Used for filtering values for browsing certain number of days or weeks (e.g., Last Day, Last 7 Days, Last 365 Days, etc.). |
Measure Dimension
This dimension contains the classification that categorizes file systems.
| Attribute | Description |
|---|---|
| Measure | Contains the type of data measured for the file systems. The available values are Used, Free, and Total. |
Modify Temperature Dimension
This dimension contains the classification for file temperatures that categorizes its age of modification.
| Attribute | Description |
|---|---|
| Modify Temperature | Contains the categories that shows how long ago the file was written to. The following are the available values: - hot - 0 to 30 days old - warm - 30 to 90 days old - tepid - 90 to 360 days old - cold - 360 to 720 days old - frozen - more than 720 days old. |
Read Temperature Dimension
TThis dimension contains the classification for file temperatures that categorize its age of last read.
| Attribute | Description |
|---|---|
| Read Temperature | Contains the categories that shows how long ago the file was read. The following are the available values: - hot - 0 to 30 days old - warm - 30 to 90 days old - tepid - 90 to 360 days old - cold - 360 to 720 days old - frozen - more than 720 days old. |
Time Classifications
A trend report shows usage over time. To present this in a graphical report, time classification must be included.
To use the Time Dimension, please use its description in the section Time Classifications.