Chart View
This contains the interactive chart for visualizing reports created in the interactive table.
Interactive Chart
The Interactive Chart is based on the same concept as the Drop Area table. Choose from a variety of presentation formats, including Line, Bar, Pie and Area charts. The Drop Area chart is linked to the Interactive Table. Any changes made in either the Drop Area table or the Drop Area chart will be reflected in the other presentation. It has the following parts:
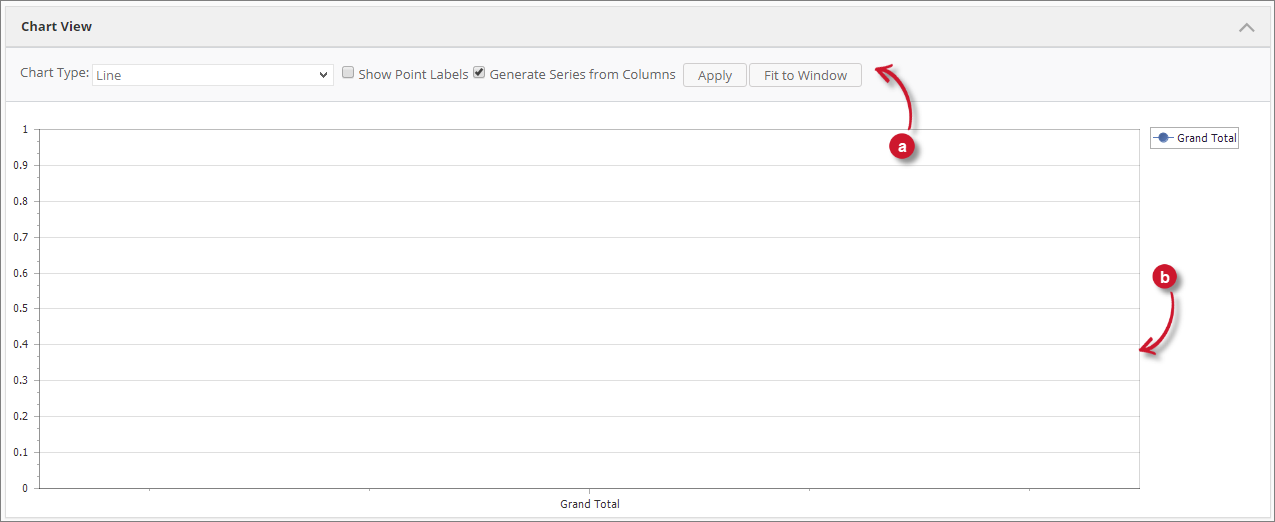
a. Chart Controls - this contains the various controls on how data is displayed in the chart.
b. Chart Area -this contains the presentation of the chart.
Chart Controls
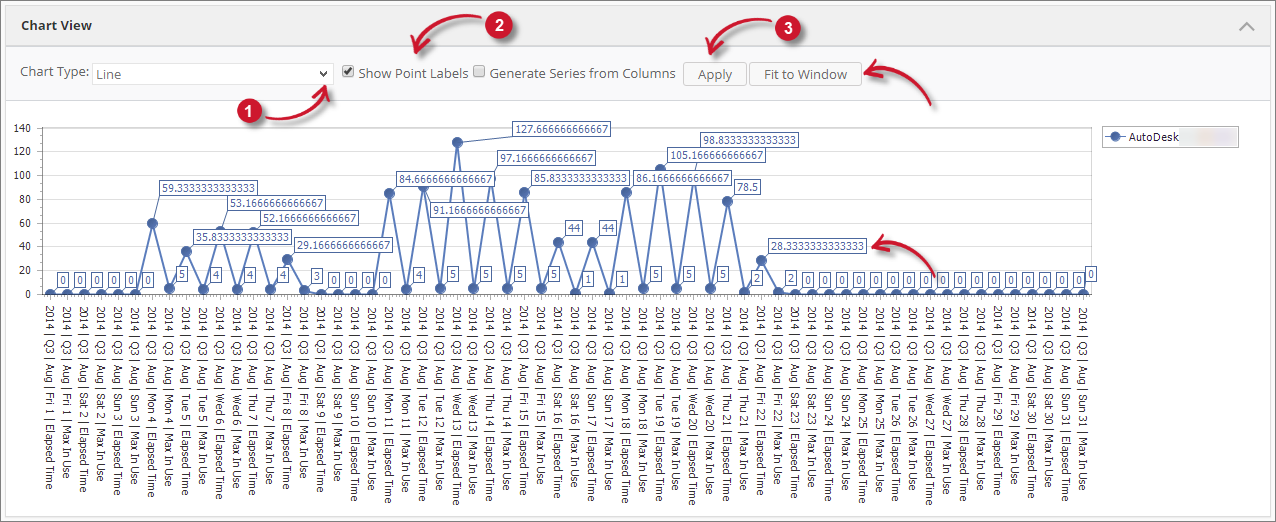
Follow these instructions to use the various chart controls:
-
Choose among the Chart Type options. Line Chart is selected by default.
-
Tick for the following options to be applied in the chart.
Control Description Show Point Labels Displays data labels on each point in the chart. Generate Series from Columns Classifications reported as columns in the interactive table are shown as series.This is enabled by default. Interactive Chart Controls -
Click the Apply button.
The interactive chart should be refreshed based on the provided chart control values.
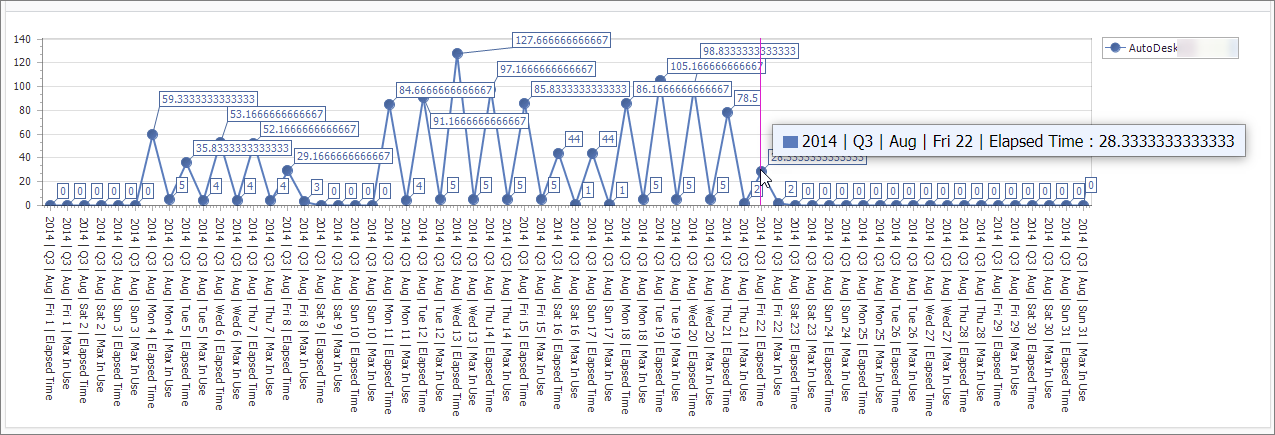
Chart Area
To navigate around the chart area, hover over the elements in the chart and the information card containing specific details of the pointed data should be shown.