Basic Reporting
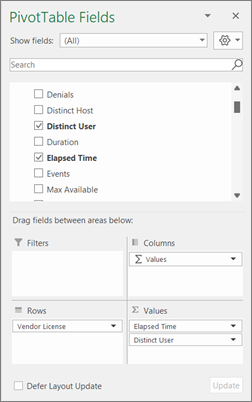
To create a simple report, add a field to the PivotTable by ticking the check box beside the field name in the PivotTables Fields pane.
Selected fields are placed in their default areas: non-numerical fields are added to Rows, date and time hierarchies are added to Columns, and numerical fields are added to Values.
Drag the field to move it to another area.
PivotTable Fields
Click the ![]() funnel icon beside a value to sort and filter.
funnel icon beside a value to sort and filter.
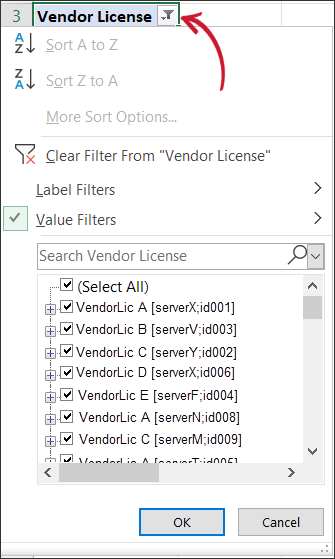
Filters
To create a chart corresponding to the existing PivotTable, select the PivotTable or any cell inside the PivotTable, then go to the Insert tab and select the chart type.
note
Refer to the official Microsoft documentation for a more comprehensive Excel reporting guide.